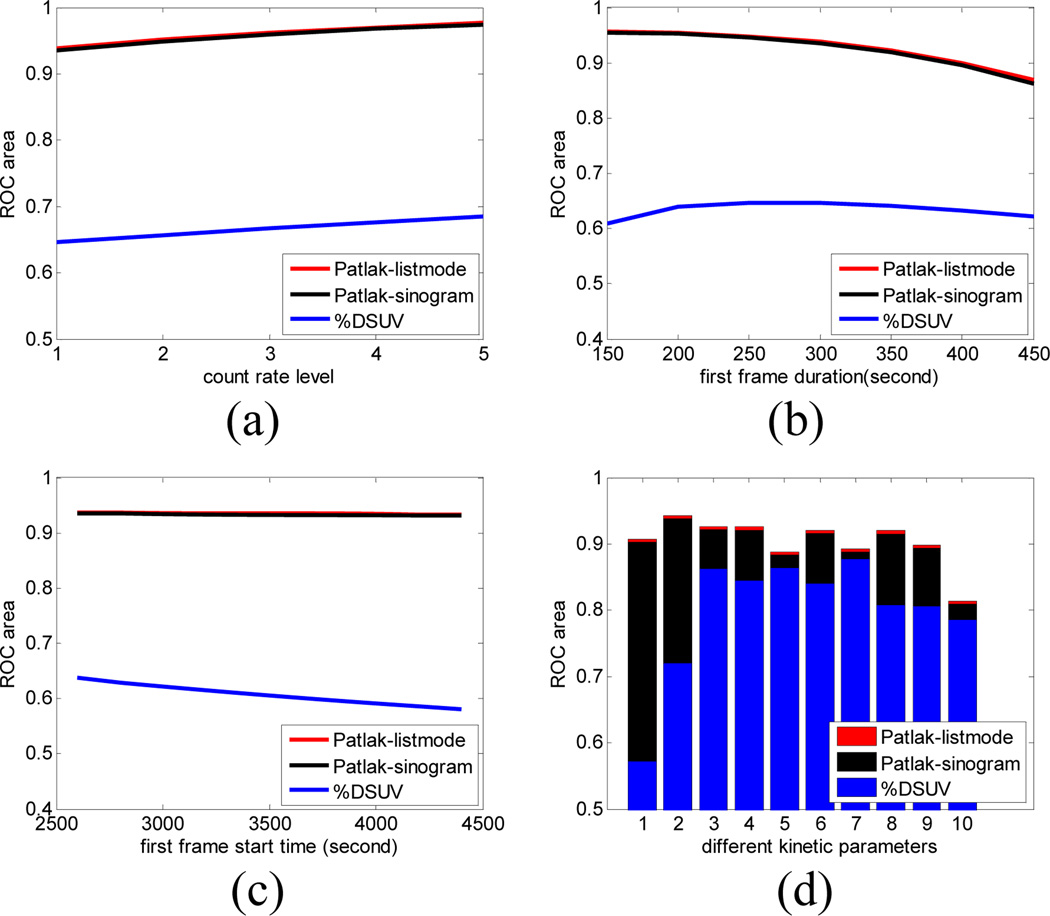
Fig. 4.
Detection of tumors relative to background using rate parameters from Table 1. We compare area under ROC curves (AUC) for Patlak slope (sinogram and list-mode based estimation) and %DSUV as a function of (a) count rate, (b) duration of first frame, and (c) first frame start time. Panel (d) shows the area under the ROC curves averaged over simulations for different parameter sets listed in Table 1.

