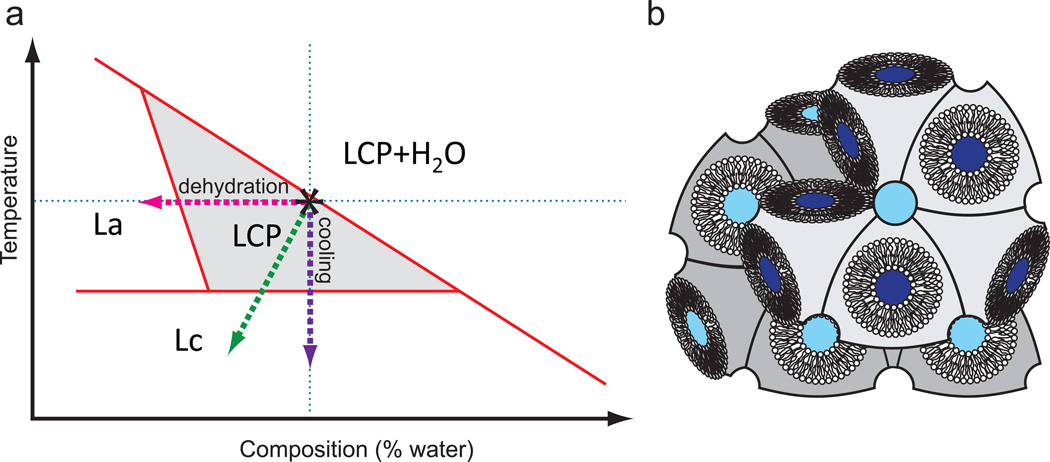
Figure 3. Phase behavior of MAG lipids.
(a) Simplified temperature-composition phase diagram for monoacylglycerol lipids (MAGs). The exact phase transition boundaries depend on the lipid nature, detergent concentration and composition of the precipitant. The area that corresponds to pure LCP is shaded. Crystallization experiments are performed at room temperature and at the full hydration boundary (marked by an asterisk). Evaporative dehydration upon injection of LCP in vacuum is shown by a green dashed line. (b) Cartoon representation of a lipidic cubic phase.

