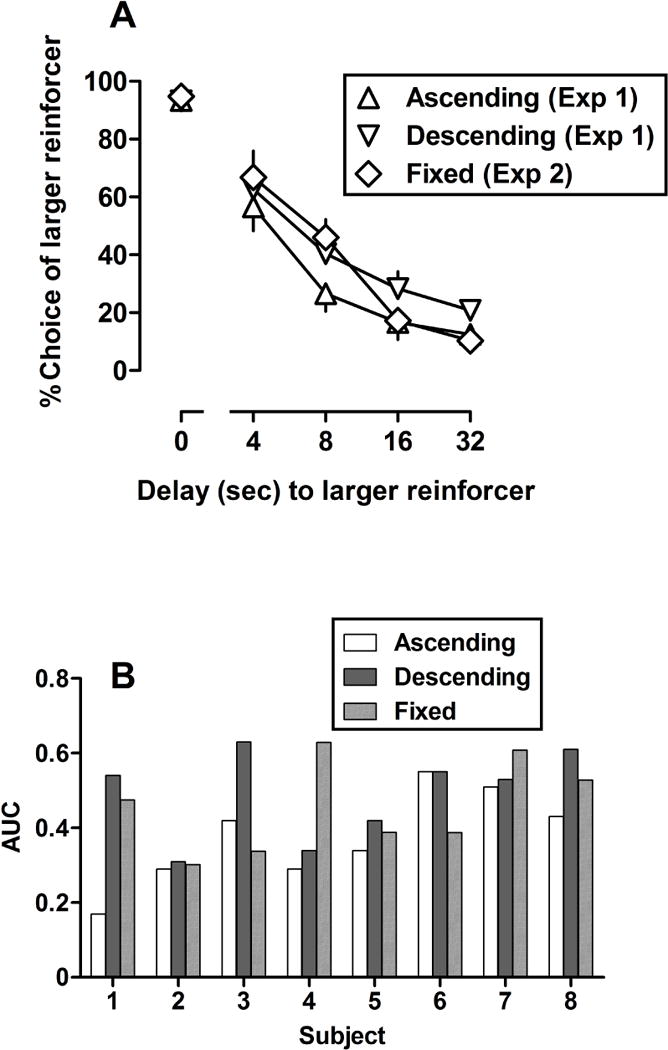
Fig 1.

(A) Percent choice of the larger reinforcer plotted as a function of delay (in seconds) to the delivery of the larger reinforcer in the same group of rats (n=8) trained under the ascending (triangles), descending (inverted triangles), and fixed (diamonds) delay conditions. Data points indicate the group means and error bars indicate the standard error of the mean. (B) Area under the curve (AUC) for individual subjects responding under the ascending (white bars), descending (dark bars), and fixed (lightly shaded bars) delay conditions (see Data Analyses for further details).
