
Figure 4.
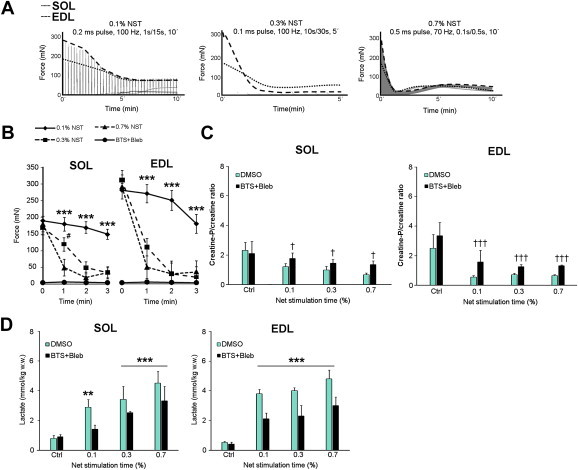
Metabolic responses to electrically stimulated contraction protocols representing different intensities. A) Representative force curves from low (0.1% net stimulation time (NST)), intermediate (0.3% NST) and high (0.7% NST) intensity electrical stimulation regimens in mouse soleus (SOL) and extensor digitorum longus (EDL) muscles B) quantification of the peak force production for the first 3 min with 0.1, 0.3 and 0.7% NST electrical stimulation regimens and myosin ATPase blocker treated muscles, ***p < 0.001 0.1% NST vs. BTS + Bleb, #p < 0.05 0.1% NST vs. 0.3% NST using Tukey's post hoc test. C) Creatine-phosphate/creatine ratio in SOL and EDL muscles under the conditions described above, †/†††p < 0.05/0.001 ANOVA BTS + Bleb main effect. D) Lactate production in SOL and EDL, **/***p < /0.01/0.001 contraction-effect vs. ctrl using Tukey's post hoc test. n = 6–8. Data are mean ± S.E.M.