
Figure 5.
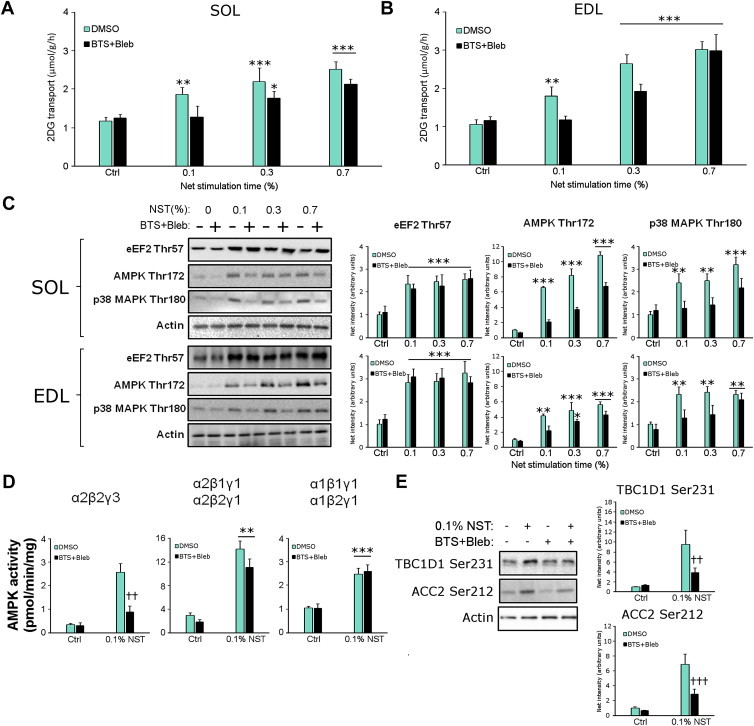
Low-intensity electrically-induced contraction-stimulated glucose transport but not Ca2+ release is abolished by myosin ATPase blockade. 2-deoxyglucose (2DG) transport in A) soleus (SOL) and B) extensor digitorum longus (EDL). C) Representative western blots and quantifications in SOL (top) and EDL (bottom). D) AMPK heterotrimer activities in EDL and E) Representative western blots and quantifications of known AMPK substrates TBC1D1 Ser231 and ACC2 Ser212 in EDL. */**/***p < 0.05/0.01/0.001 contraction-effect vs. ctrl or in (B) 0.1% NST vs. 0.3% NST using Tukey's post hoc test, #p < 0.05 contraction-effect 0.3% NST vs. 0.7% NST, ††p < 0.01 ANOVA contraction × inhibitor interaction. n = 6–8. Data are mean ± S.E.M.