
Figure 4.
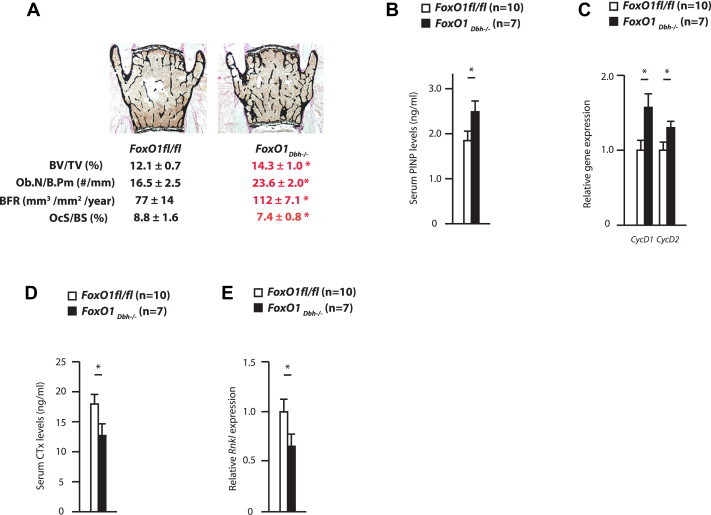
(A) Bone histomorophometric analysis of 36 week-old FoxO1fl/fl (n = 10) and FoxO1Dbh−/− (n = 7) mice. BV/TV: Bone volume per tissue volume. Ob.N/B.Pm: Number of osteoblasts per bone perimeter. BFR: Bone formation rate. OcS/BS: Osteoclast surface per bone surface. (B) Serum PINP levels in 36 week-old FoxO1 FoxO1fl/fl and FoxO1Dbh−/− mice. (C) Cyclin expression in 36 week-old FoxO1fl/fl and FoxO1Dbh−/− bone. (D) Serum Ctx levels in 36 week-old FoxO1fl/fl and FoxO1Dbh−/− mice. (E) Rankl expression in 36 week-old FoxO1fl/fl and FoxO1Dbh−/− bones.