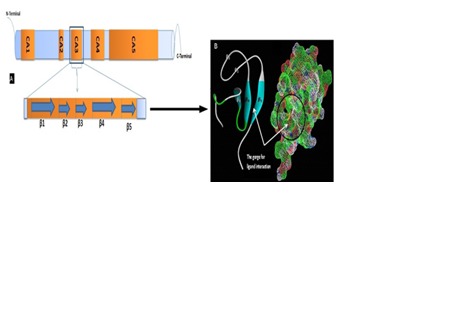
Figure 1.

A) The schematic diagram shows the domains of knase suppressor of Ras with their terminals. The cysteine rich C1 domain − CA3 is emphasized to show their protein structure makup. The marking ( ) shown in the image indicates the respective beta sheets; B) Secondary structure showing the beta sheets (β1, β2, β3, β4, β5) containing amino acid residue at the gorge. The mesh diagram with encircled areas shows the gorge of KSR C1 domain. (Images have been visualized using Accelrys discovery studio 4.0 and Pymol viewer). The schematic diagram is created based on the information as per the literature.
