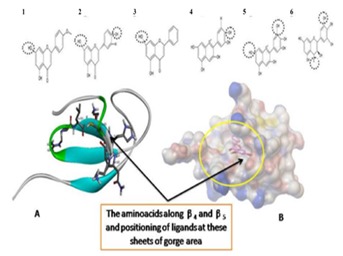
Figure 6.

The ligands (1 to 6 as shown in table 1) above the crystal structure shows the hydroxyl groups (black dotted circles) involved in interaction through hydrogen bonding at the receptor site. A) Most of the interactions were with the amino acids along the beta sheet ARG 363, LYS365, ASN368, and LYS369 and B) Surface image with ligand (acacetin) positioning at its lowest binding energy (ΔG) at the gorge along the β4 and β5.
