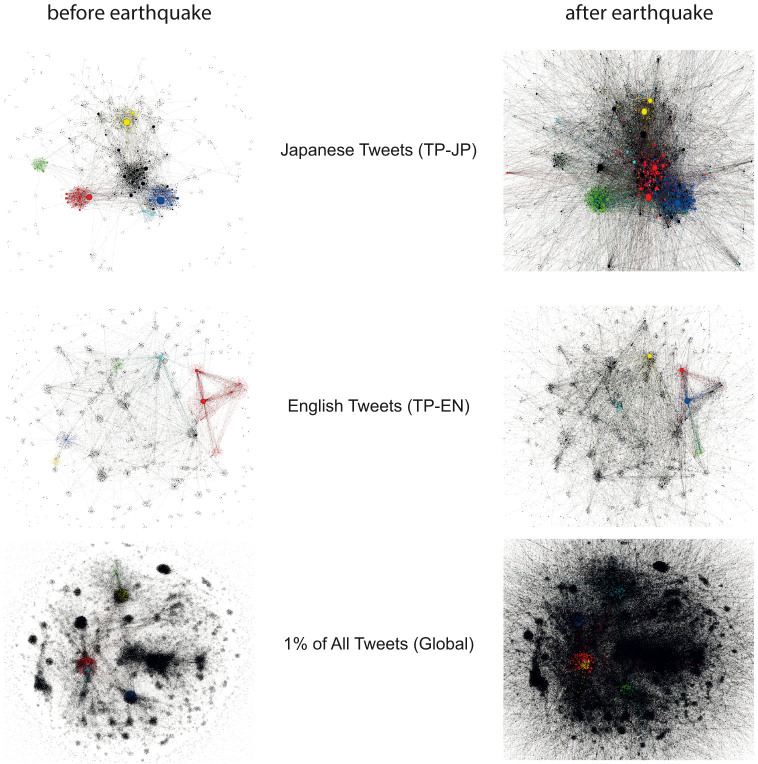
Figure 2. Network visualization of Japanese and English tweets before and after the earthquake.
Each node has the same x-y coordinates before and after. Node size is proportional to its outdegree. Nodes in the five largest communities detected by Infomap are colored, in order from the largest to the fifth largest: red, blue, green, yellow, and light blue.

