
Figure 4.
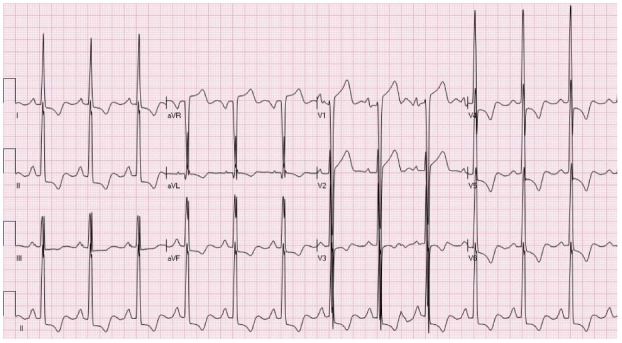
An electrocardiogram showing typical pattern of ST elevation due to hypertrophy of the left ventricular with secondary repolarization changes. There is ST elevation in leads V1-V2 and ST depression with T wave inversion in the inferolateral leads.