
Figure 2.
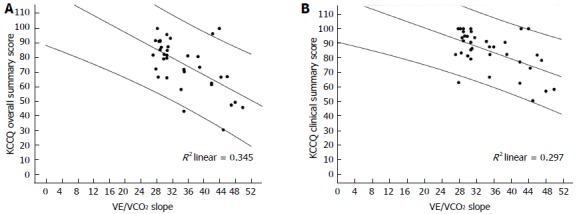
Scattergrams of correlations of Quality of Life (Kansas City Cardiomyopathy Questionnaire Overall Summary Score, Kansas City Cardiomyopathy Questionnaire Clinical Summary Score) with VE/VCO2 slope (A and B, respectively).
Official websites use .gov
A
.gov website belongs to an official
government organization in the United States.
Secure .gov websites use HTTPS
A lock (
) or https:// means you've safely
connected to the .gov website. Share sensitive
information only on official, secure websites.
Scattergrams of correlations of Quality of Life (Kansas City Cardiomyopathy Questionnaire Overall Summary Score, Kansas City Cardiomyopathy Questionnaire Clinical Summary Score) with VE/VCO2 slope (A and B, respectively).