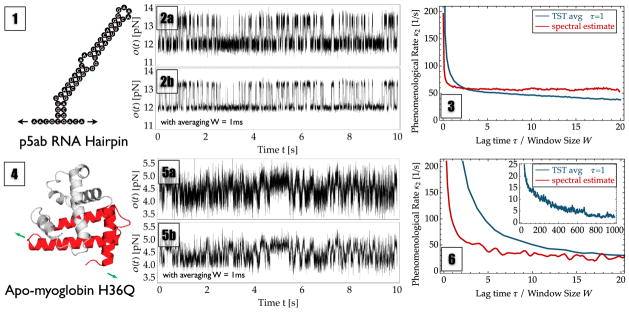
FIG. 3.

Probed systems by optical tweezer experiments. Top: RNA hairpin p5ab. Bottom: H36Q mutant of sperm whale apomyoglobin. Panels (1) and (4) show schematic views of the probed system in its native secondary or tertiary structure including the direction of the pulling force (green and black arrows). Panels (2) and (5) show the traces used for analysis. Row (a) reports the results when directly analyzing the measured 50 kHz data, while row (b) reports the results when analyzing data that has been binned to 1 kHz to reduce the noise amplitude. Panels (3) and (6) show the estimated phenomenological rates κ̂2 for TPT (blue line) using different averaging window sizes W (x axis) and spectral estimation (red line) for different lag times τ (x axis). For apo-myoglobin, the inset displays the behavior of TST at large window sizes W, where the rate is systematically underestimated.
