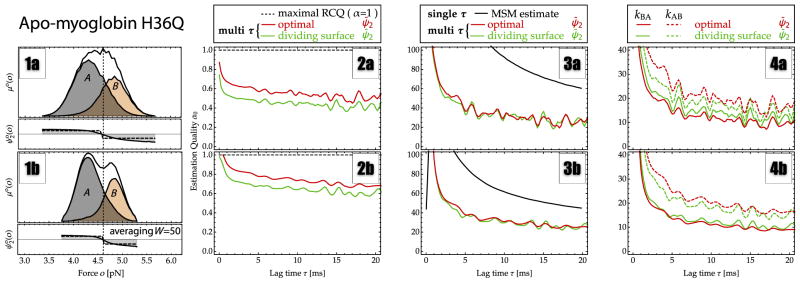
FIG. 5.

Estimates for rates and estimation qualities from passive-mode single-molecule force-probe experiments of apo-myoglobin. All panels report the estimation results, showing the direct Markov model estimate (black line), a fit to the fluctuation autocorrelation function using a dividing surface at the histogram maximum (minimum between two maxima for filtering) o = 4.6 pN (green line), and spectral estimation (red line). (1a),(1b) The stationary probability of observing a given force value (solid black line). The partial probabilities of states A (gray) and B (orange) obtained by spectral estimation show that there is very little overlap between the states. (2a),(2b) The estimation quality αo, coinciding with the OQ α̂o, for spectral estimation. (3a),(3b) Estimated relaxation rate κ2. (4a),(4b) Estimated microscopic transition rates kAB (dashed line) and kBA (solid line).
