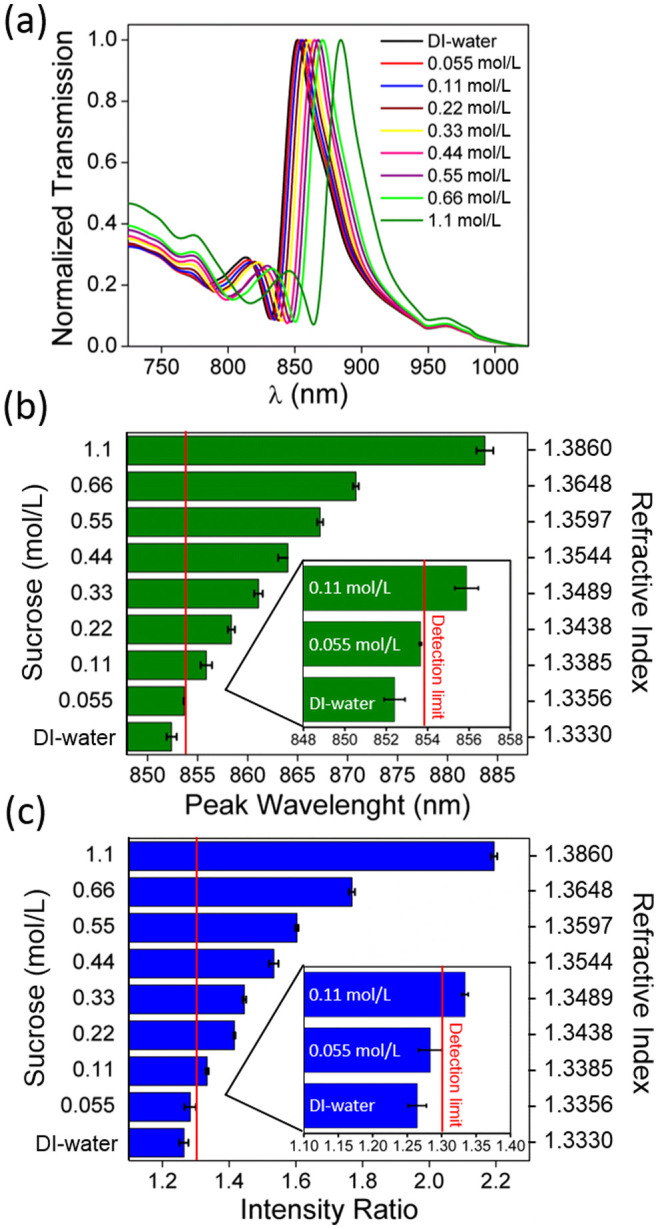
Figure 4. Quantification of sucrose solutions at different concentrations and refractive indices using our computational plasmonic biosensing platform on a microfluidic chip.

(a) Spectral response of the plasmonic sensors under various concentrations of sucrose samples, ranging from 0.055 to 1.1 mol/L. Analysis of (b) the peak wavelength shift in the plasmonic mode determined from the optical spectrometer measurements and (c) the corresponding intensity ratio analysis determined using the dual-wavelength lensfree images (error bar at each data point corresponds to the measurements obtained from 3 different samples). Figure inset: Zoomed version of the lower concentration sucrose measurements to demonstrate the detection limit, shown with a red line.
