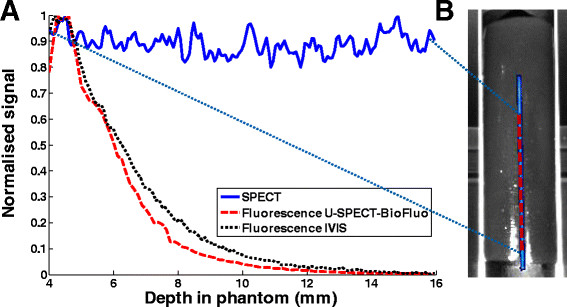
Figure 5.

Effects of depth-dependent attenuation. (A) Fluorescence signal (phantom background level subtracted) and SPECT signal of capillary versus depth in gel phantom. The maximum SPECT and fluorescence signals have been normalized to 1. (B) The positions of the axial line profiles are indicated in the top-view image of the phantom.
