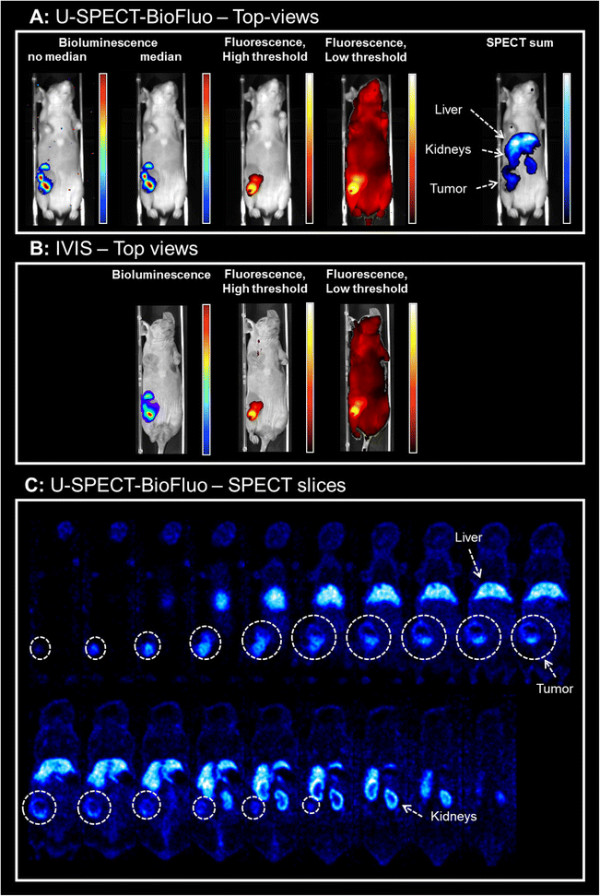
Figure 7.

Imaging results for a mouse with a 4 T1-luc + tumor. Bioluminescence images are obtained by D-Luciferin injection. Fluorescence and SPECT images are obtained by injection of multimodal tracer 111In-RGD-MSAP. (A) U-SPECT-BioFluo. Bioluminescent images both with and without median filter applied. (B) IVIS. (C) U-SPECT-BioFluo: 1-mm thick horizontal SPECT slices (anterior to posterior). Organs have been indicated in the SPECT images. White circles indicate the tumor location in the slices.
