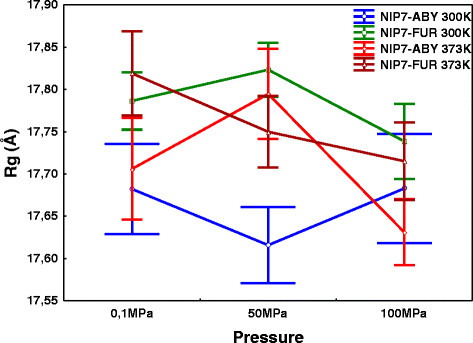
Figure 3.

Dependencies of the radius of gyration (Rg, Y axis) on pressure (X axis) at high and low temperatures for the Nip7 protein models NIP7-ABY and NIP7-FUR. Whiskers indicate the 95% confidence intervals. Blue, the NIP7-ABY model, 300 K; green, the NIP7-FUR model, 300 K; red, the NIP7-ABY model, 373 K; brown, the NIP7-FUR model, 373 K.
