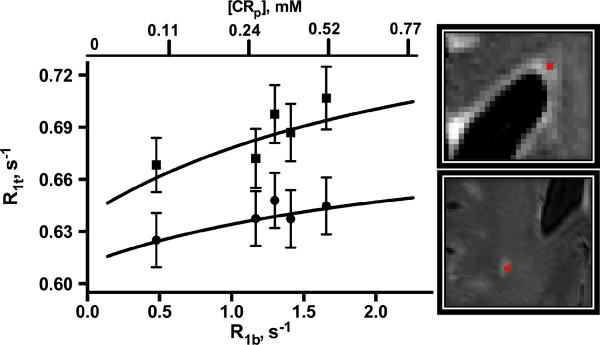
Figure 2.

Relationship between R1t and R1b values in a dWMH (circle) and pWMH (square) voxel (shown at far right). Curves represent the best fit of the data in each WMH to Eq. (1). Error bars (±SD) are based on Monte Carlo simulations (see text). Upper axis represents plasma CR concentration, as calculated from Eq. (3).
