
Figure 3.
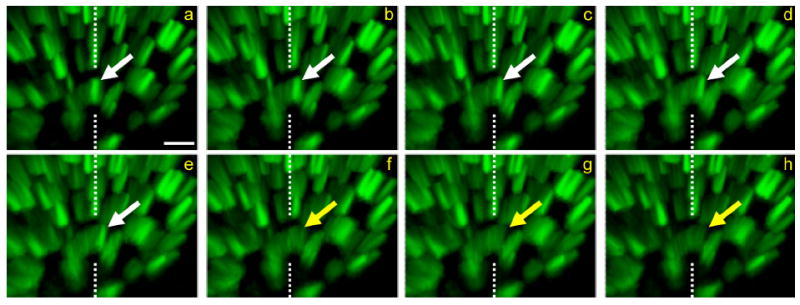
Exocytosis of MEs continues long after stimulation. Time-lapse sequence of disappearing ME. The preparation was briefly stimulated with bath-applied FM1-43. a–h: Eight sequential frames from a 4D data set (six image planes, 1.5-μm spacing, 1-minute interval). The arrow follows the lateral movement and disappearance (indicated by change of arrow color from white to yellow) of one ME between frames e and f, approximately 55 minutes after stimulation. The dashed lines reference the position of the ME in frame a. At light-level resolution, the ME disappears as it contacts the membrane, consistent with exocytosis. The terminal is viewed obliquely (Imaris software) so that both the x-y plane and the z-axis depth can be appreciated. Scale bar = 1 μm in a (applies to a–h).