
Fig. 3. AATK expression in cancer cells, reexpression and demethylation under Aza treatment.
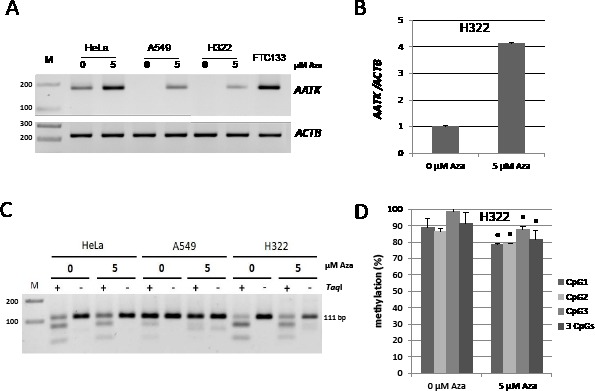
A. Expression analysis of AATK is shown after Aza treatment (0 and 5 μM) in HeLa, lung cancer cell lines A549 and H322 and thyroid cancer cell line FTC133. AATK (170 bp) and ACTB (226 bp) levels were analyzed by RT-PCR after four days of Aza treatment on a 2% gel. B. Expression of AATK was analyzed in H322 cells by quantitative RT-PCR after Aza treatment and normalized to ACTB. C. COBRA analysis is shown after Aza treatment. Product of TaqI digest (+) and mock digest (−) were resolved on a 2% gel with a 100 bp marker (M). D. AATK methylation analysis was performed in lung cancer H322 and quantified by bisulfite pyrosequencing. Three CpGs are included in analyzed region and according mean and SD are shown. P values were calculated using two tailed t-test (* = p<0.05).