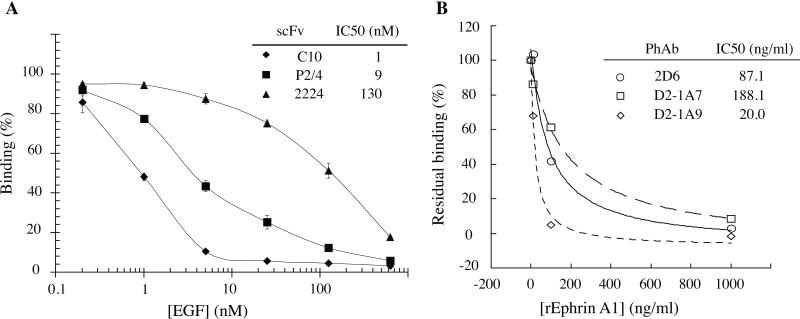
Figure 5. Effect of ligand on the binding of EGFR and EphA2 antibodies to cell surface receptors.
(a) Binding of EGFR scFv C10 (◇), P2/4 (■), and 2224 (sh-utrif) to MDAMB468 cells in the presence of increasing concentrations of EGFR ligand, EGF was determined by flow cytometry. (b) EphA2 antibodies D2-1A7 (□), D2-1A9 (◇), and 2D6 (sh=cir) compete with ephrin A1 for binding to MDAMB231 cells. Ability of phage antibodies D2-1A7, D2-1A9, and 2D6 binding to MDAMB231 cells in the presence of increasing concentrations of EphA2 ligand, Ephrin A1 was determined by flow cytometry. This figure cited images from reference #36.

