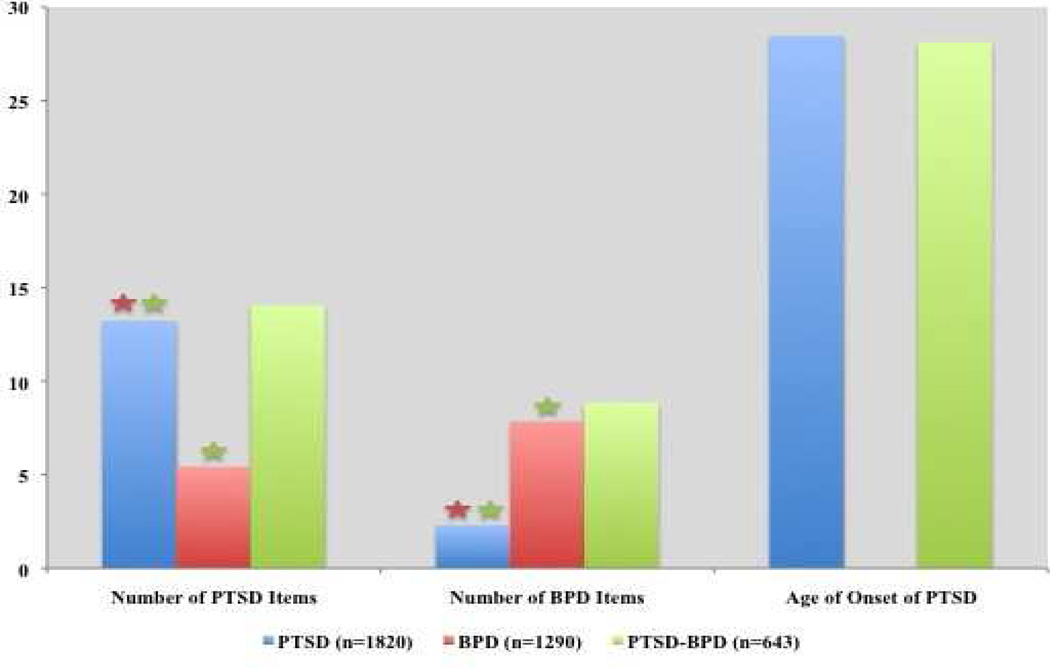
Figure 2. Relationships between posttraumatic stress disorder (PTSD), borderline personality disorder (BPD) and their combination (PTSD + BPD) and number of PTSD and BPD symptoms endorsed and age of onset of PTSD.
displays mean scores and differences between group means derived from multiple linear regressions. The model is adjusted for gender, age, ethnicity, education, marital status, household income, and number of lifetime Axis I mental disorders (none, 1 disorder, 2 disorders, 3+ disorders). Red stars indicate that the group mean is significantly different from the BPD alone group mean at p<.001 and green stars indicate that the group mean is significantly different from the PTSD-BPD group mean at p<.01.

