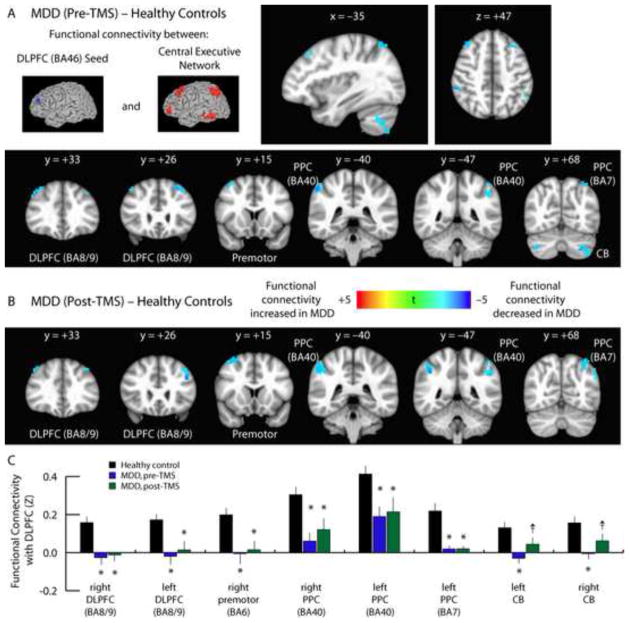
Fig. 1. Persistence of depression-related hypoconnectivity in the CEN after TMS.
A. Compared to healthy control subjects, depressed patients exhibited decreased functional connectivity between the DLFPC and multiple nodes of the central executive network, including premotor cortex (BA6), two regions of posterior parietal cortex (PPC: BA40, BA7), bilateral cerebellum (CB), and other areas of lateral prefrontal cortex (DLPFC: BA8/9). Images depict t statistics for the contrast of patients pre-treatment versus healthy controls. These images and all subsequent images are presented in radiological convention and are labeled with the corresponding planar coordinate in MNI space.
B. These effects persisted when the same patients were scanned after completing a 5-week course of TMS.
C. Quantification of data extracted from the coordinates of the peak t statistic from each of the areas labeled in panels 1A and 1B. For coordinates and statistics, see Supplemental Table S4. Error bars = S.E.M. * = p < 0.05, corrected for multiple comparisons. † = p < 0.01, uncorrected, but not significant after correcting for multiple comparisons.

