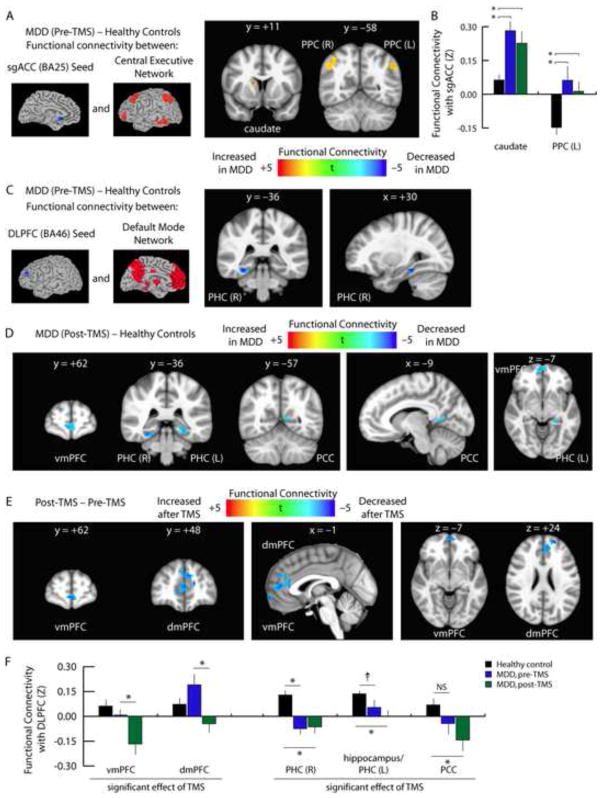
Figure 3. TMS modulates interactions between the DMN and CEN.
A. Compared to healthy control subjects, functional connectivity between the sgACC and the CEN was abnormally elevated in depressed patients. Affected areas included the right caudate nucleus and bilateral posterior parietal cortex (PPC, BA40). Images depict t statistics for the contrast of patients prior to treatment versus healthy controls.
B. Quantification of the data depicted in panel 3A. Hyperconnectivity with the right caudate, left posterior parietal cortex, and right posterior parietal cortex (data not shown, see Supplemental Fig. S10) persisted after treatment, and there were no significant effects of TMS. Error bars = S.E.M. * = p < 0.05, corrected for multiple comparisons.
C. In contrast, depressed patients exhibited decreased functional connectivity between the DLPFC and a right parahippocampal area (PHC) of the DMN.
D. Hypoconnectivity between the DLPFC and the DMN either persisted or increased after TMS. Affected areas included ventromedial (vmPFC), bilateral parahippocampal cortex (PHC), and posterior cingulate cortex (PCC).
E. Repeated measures ANCOVA identified significant effects of TMS on functional connectivity between the DLPFC and two medial prefrontal areas of the DMN. The vmPFC cluster overlapped with the cluster in panel 3D. In both areas, connectivity was reduced, and neither area differed from controls prior to treatment.
F. Quantification of data extracted from the coordinates of the peak t statistic from each of the areas labeled in panels 3C–E. For coordinates and statistics, see Supplemental Table S6. Error bars = S.E.M. * = p < 0.05, corrected for multiple comparisons. † = p < 0.01, uncorrected, but not significant after correcting for multiple comparisons. NS = not significant.

