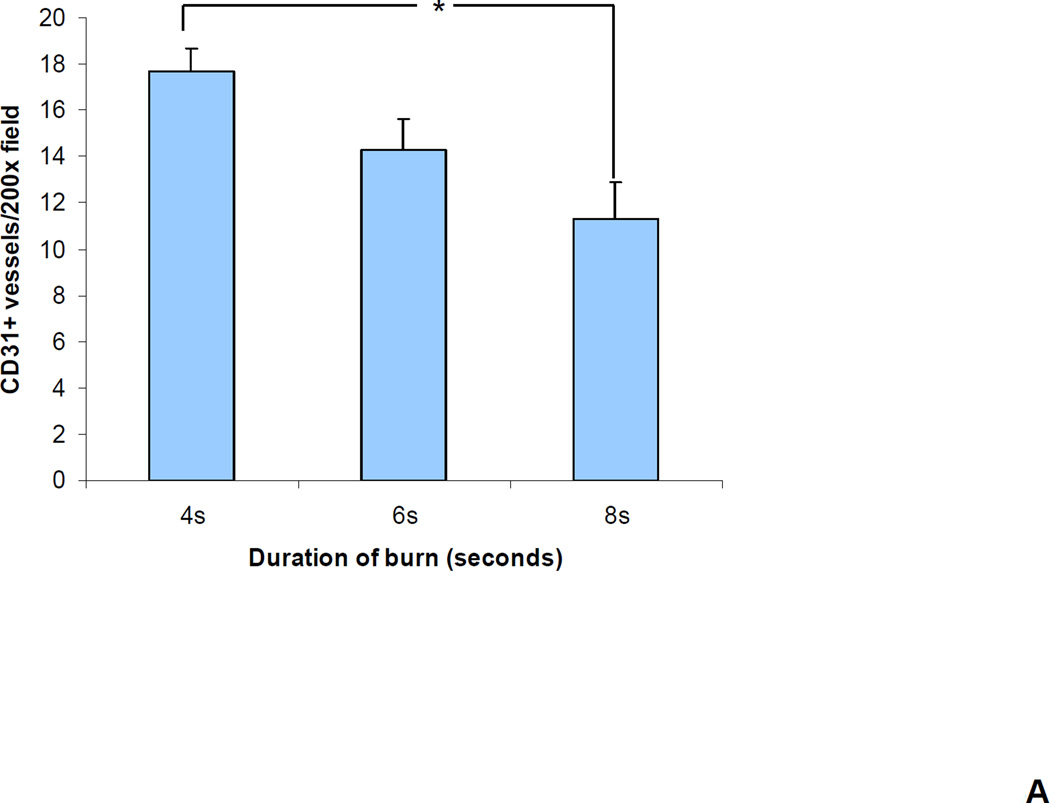
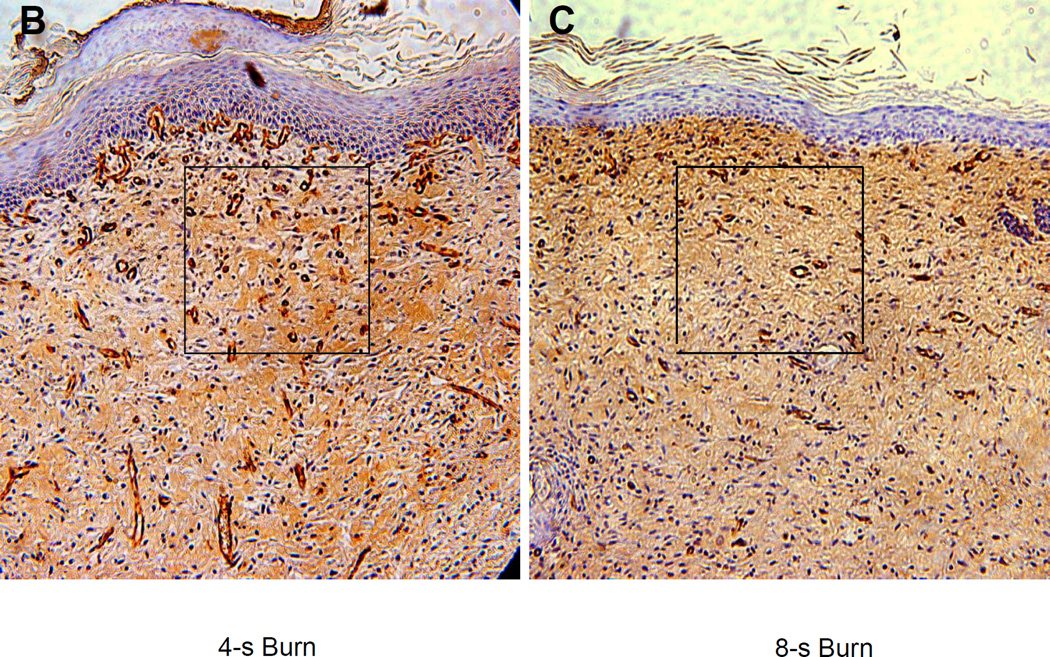
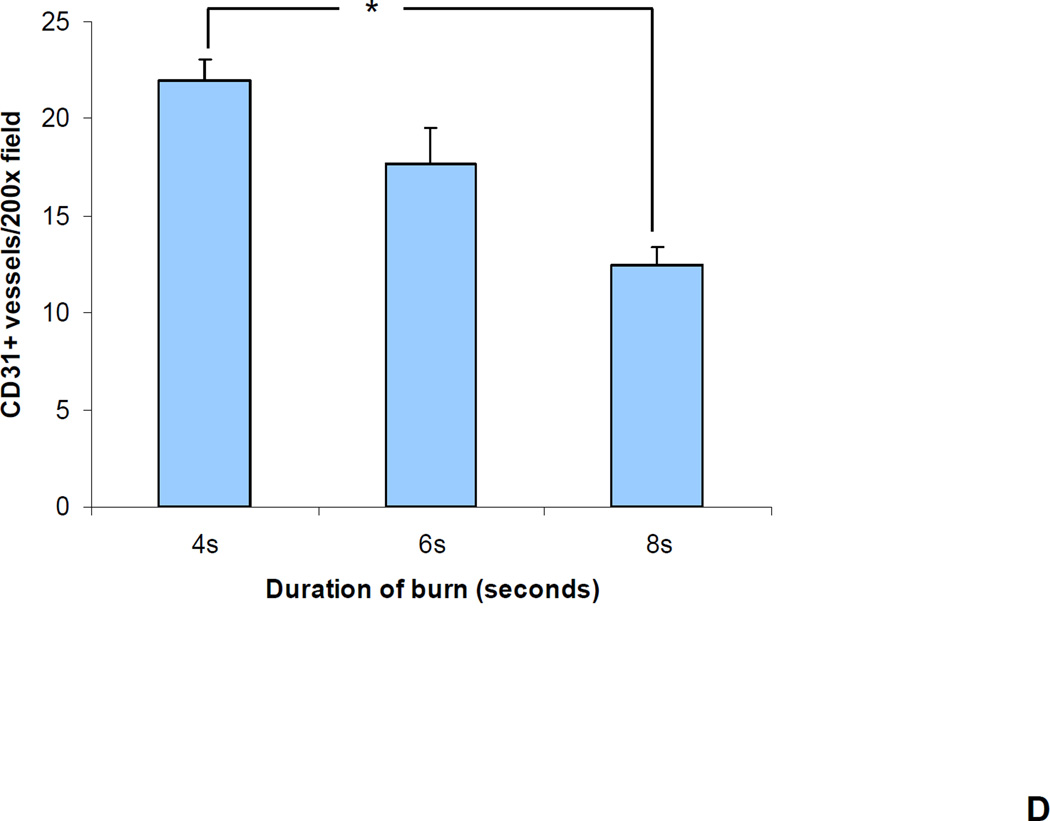
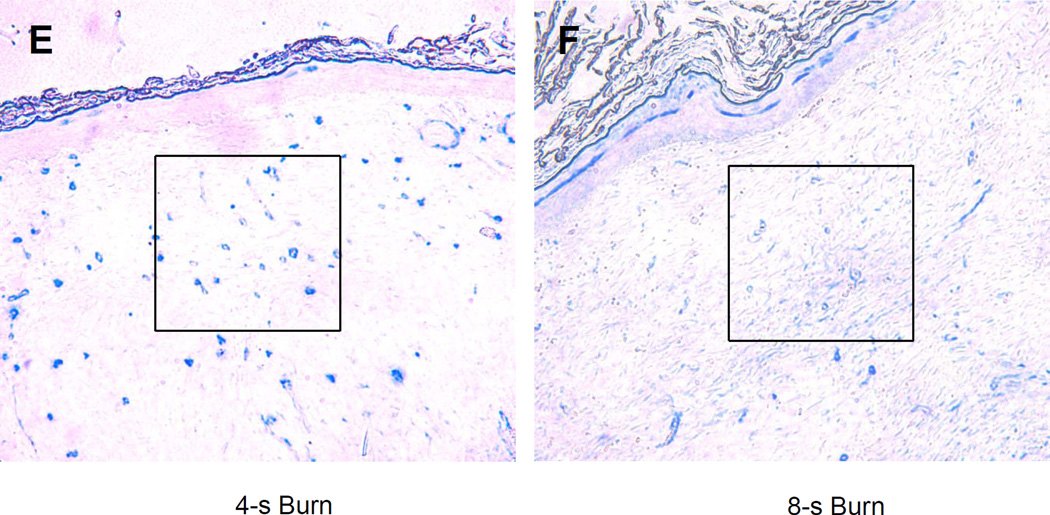
Figure 4. Immunohistochemical analysis of wound vascularization.
(a–b) CD31 staining. (a) Bar graph shows the mean (± SEM) vessel counts per 200× field (*P<0.01, ANOVA with Tukey test, n = 8 for each group). (b) The central portion of a 4 and 8 second burn wound on day 21 stained with an antibody against CD31 (PECAM-1), which is expressed by vascular endothelial cells. (c–d) SMA staining. (c) Bar graph shows the mean (± SEM) number of vessels (*P<0.05, ANOVA with Tukey test, n = 8 for each group). (d) The central portion of a 4 and 8 second burn wound on day 21 stained with an antibody against smooth muscle actin (SMA), which is expressed by vascular pericytes and smooth muscle cells.


