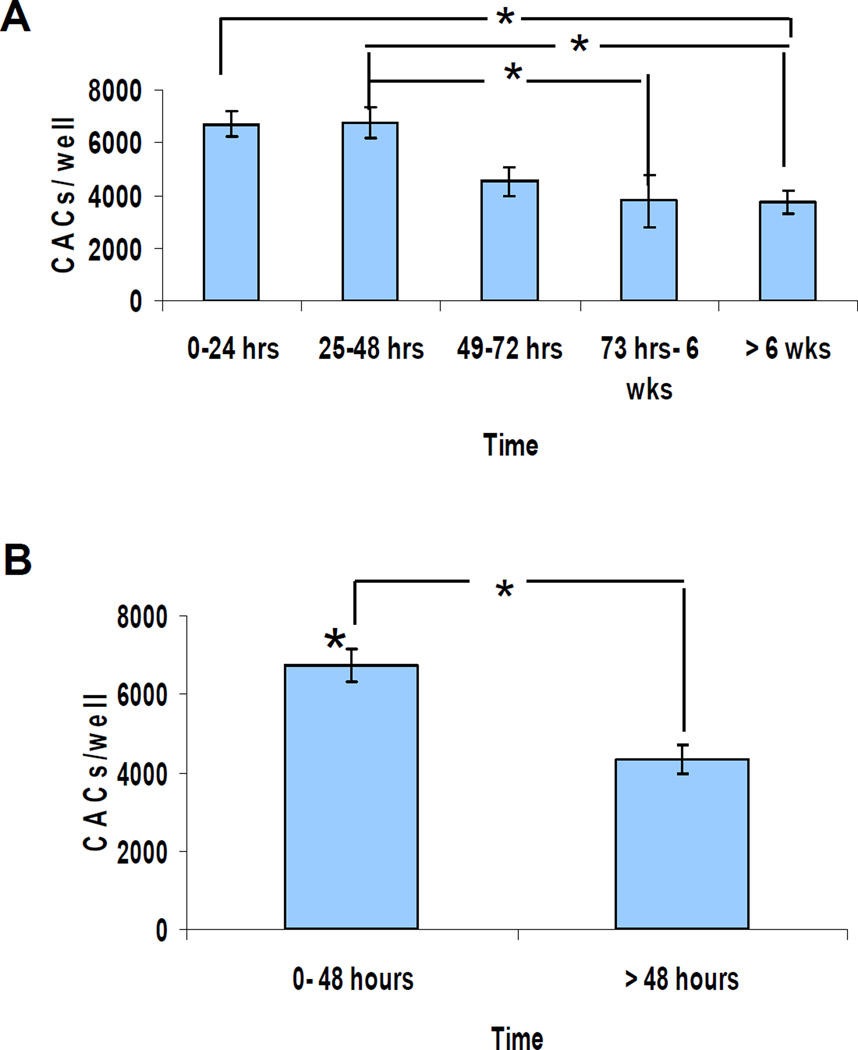
Figure 6. CAC levels in burn patients at intervals after injury.
(a) Serial analysis of CACs in burn patients. CACs were quantified in blood samples (n = 7, 15, 7, 5, and 8 for the sequential time periods studied; P<0.05, ANOVA). (b) Comparison of samples drawn in the first 48 hours after injury with later samples. The data were pooled into two groups (*P<0.001, Student’s t test, n = 22 samples in the <48 hours group and n = 20 in the >48 hours group).

