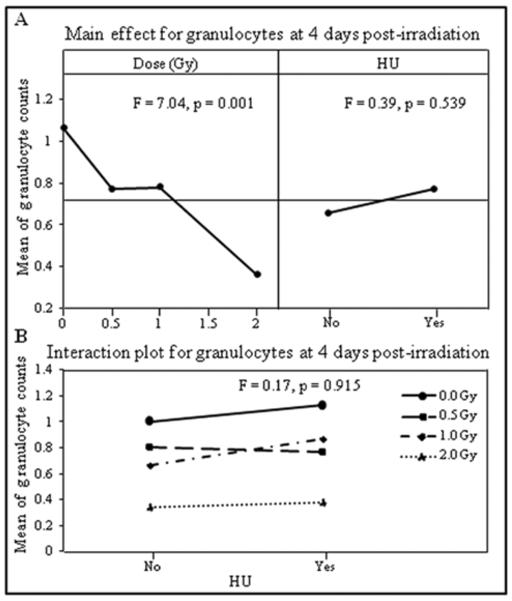
Figure 2.
Mean of granulocyte counts obtained on day four after irradiation were analyzed by DOE using a general linear model with radiation dose (Gy) and HU as independent variables. The results are presented in the main effects (A) and interaction (B) charts; the statistical significance of the main effects and interaction was determined by an F-test, with p values shown in the respective charts.

