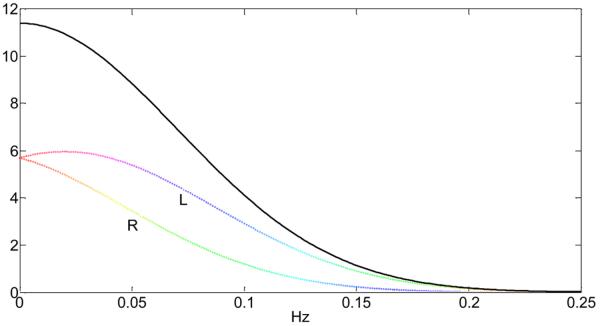
Fig.11.
Aliased frequency spectrum of the high-frequency cardiac waveform from Fig.10 using a sampling time TR = 2s. The coloring of the aliased frequencies corresponds to the coloring of the un-aliased frequencies in Fig.10. The labels L and R refer to the left (L) or right (R) side of the distribution in Fig. 10. The black curve is the total probability density of the aliased frequencies.

