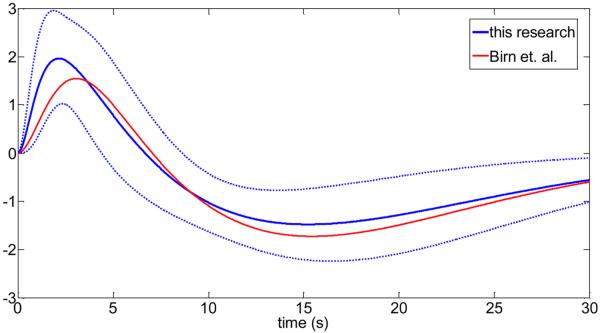
Fig.6.
Comparison of the respiratory response functions from this research with previous published work (Birn et. al. (2008)). The solid blue line is the mean over all subjects, and the broken lines are the upper and lower limit of one standard deviation from the mean of all subjects.

