
Fig.7.
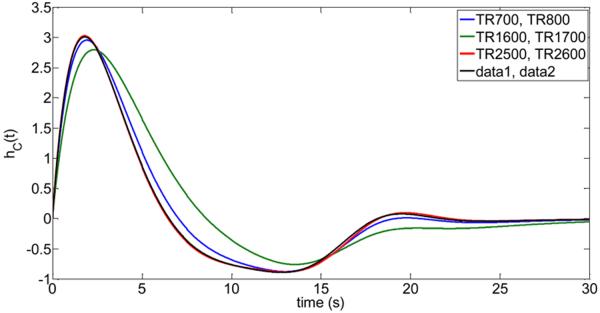
Reliability of the proposed optimization method to determine the cardiac response functions hc(t) of subject #1 using limited data (i.e. a single data set for estimation and a single data set for validation). The determined cardiac response functions are shown for the following four scenarios: 1. Blue curve: TR 700ms data set was used for estimation, TR 800ms data set was used for validation. 2. Green curve: TR 1600ms data set was used for estimation, TR 1700ms data set was used for validation. 3. Red curve: TR 2500ms data set was used for estimation, TR 2600ms data set was used for validation. 4. Black curve: Comparison to the full run using all data, i.e. TRs {700, 900, 1100, 1300, 1500, 1700, 1900, 2100, 2300, 2500} ms data sets were used for estimation, {800, 1000, 1200, 1400, 1600, 1800, 2000, 2200, 2400, 2600} ms data sets were used for validation).