Fig.9.
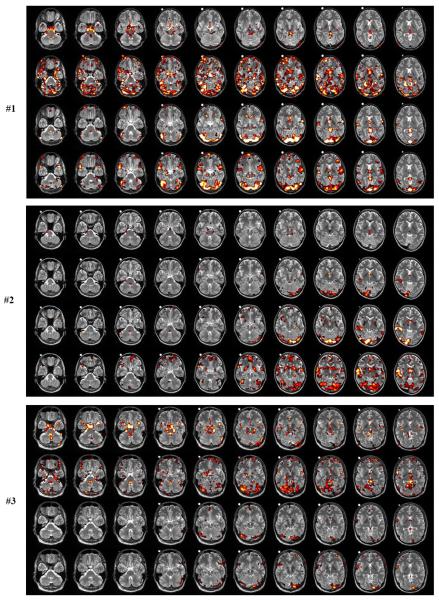
abc. Subject #1,#2,#3. Locations of significant voxels associated with high-frequency cardiac activity (1. row), high-frequency respiratory activity (2. row), low-frequency cardiac activity (3. row), low-frequency respiratory activity (4. row). The meaning of the color scale is: p=0.05 (red), p=0.01 (yellow), p=0.001 (white). The white dot visible in the structural images for the center slices is a vitamin D capsule (attached to the forehead) to indicate the right side.
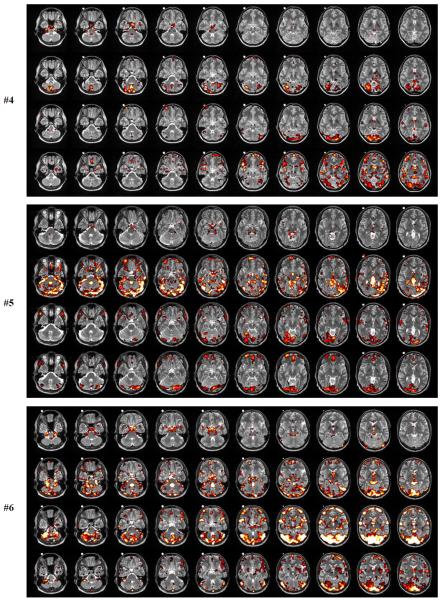
def. Subject #4,#5,#6. Locations of significant voxels associated with high-frequency cardiac activity (1. row), high-frequency respiratory activity (2. row), low-frequency cardiac activity (3. row), low-frequency respiratory activity (4. row). The meaning of the color scale is: p=0.05 (red), p=0.01 (yellow), p=0.001 (white). The white dot visible in the structural images for the center slices is a vitamin D capsule (attached to the forehead) to indicate the right side.


