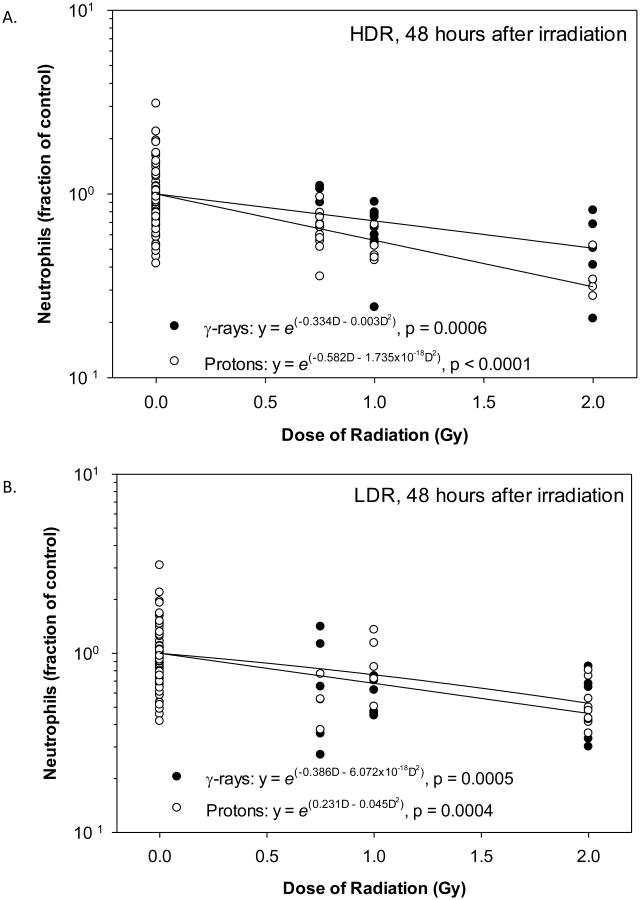
Figure 4.
Dose-response curves for neutrophils in animals after irradiation. The neutrophil count results obtained 48 hours after irradiation at HDR (A) or LDR (B) were analyzed by a non-linear regression analysis using a linear quadratic model. Statistically significant dose responses were observed for HDR and LDR γ-rays and protons.

