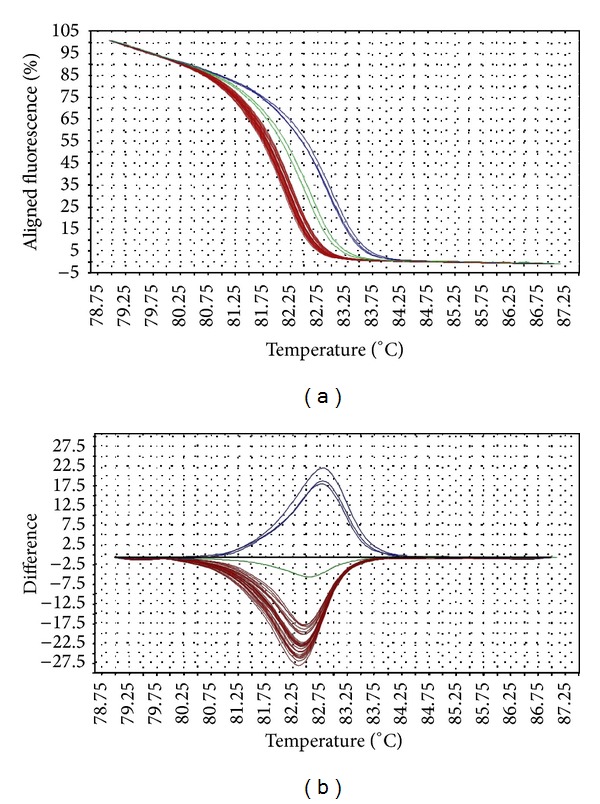
Figure 1.

Representative HRM aligned melting curves (a) and difference plot (b) for mutations in gyrA QRDR. The aligned melting curves were set at 100% at the beginning and 0% at the end of melting process. In the difference plot, the melting curves represent the temperature at which the amplicons were completely denatured. The difference of the melting temperature among the samples is clearly illustrated in the difference plot. The reference strain is indicated by the horizontal black line in the difference plot; and the wild-type samples are indicated as green line. The blue curves derived from mutants with the missense mutation D87G, whereas the red curves belong to other mutants (D87Y, D87N, S83F, and S83Y). Mutants with missense mutations D87Y, D87N, S83F, and S83Y were denatured at similar melting temperature and therefore form a tight cluster.
