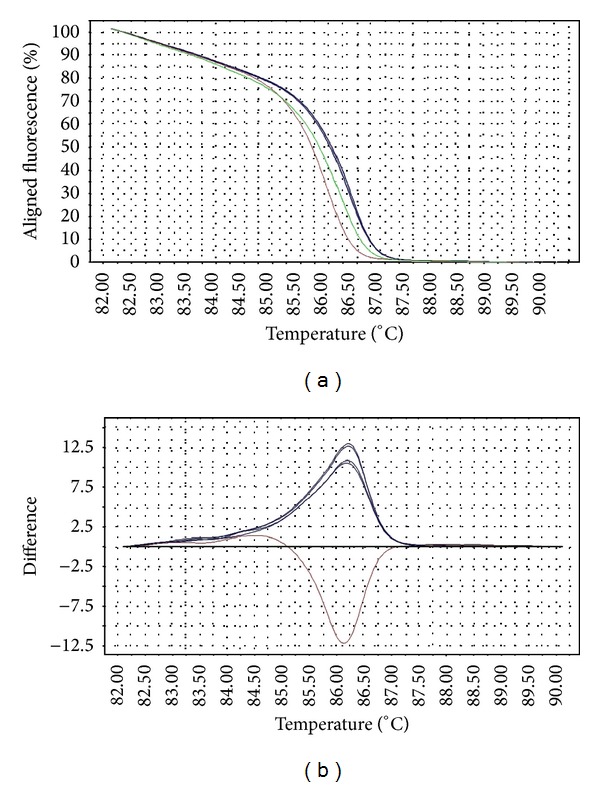
Figure 2.

Representative HRM aligned melting curves (a) and difference plot (b) for mutations in gyrB QRDR. The reference strain is indicated by the horizontal black line in the difference plot, while mutants are represented by red (6 mutations within the HRM target region) or blue curves (3 mutations within the HRM target region). All gyrB mutants are silent mutations.
