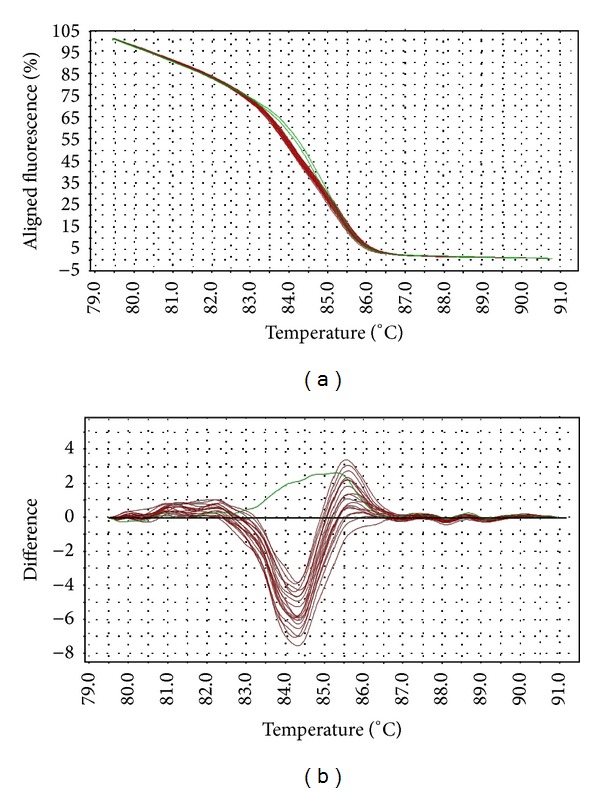
Figure 4.

Representative HRM aligned melting curves (a) and difference plot (b) for mutations in parE QRDR. The reference strain is indicated by the horizontal black line in difference plot. Wild-type samples are indicated by green curves and mutants are indicated by red curves. All mutant strains contain similar nucleotide changes in the QRDR, resulting in tightly clustered melting curves.
