Figure 10.

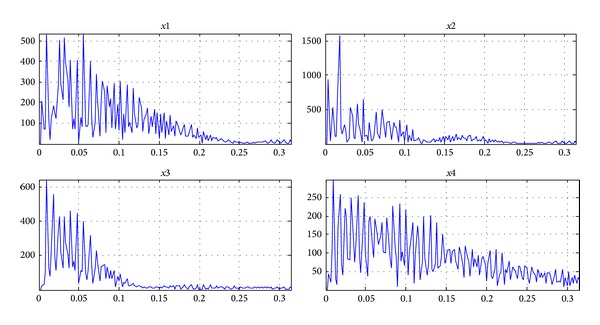
The spectrum of separated signals (x1 is the spectrum of normal ECG at positive axis; x2 is the spectrum of normal ECG at negative axis; x3 is the spectrum of J wave at positive axis; x4 is the spectrum of J wave at negative axis).

The spectrum of separated signals (x1 is the spectrum of normal ECG at positive axis; x2 is the spectrum of normal ECG at negative axis; x3 is the spectrum of J wave at positive axis; x4 is the spectrum of J wave at negative axis).