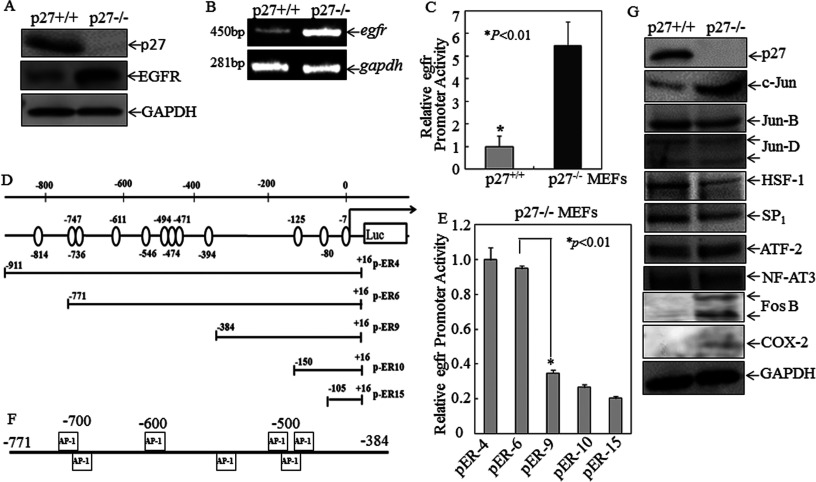
Figure 2. EGFR expression levels of protein, mRNA and transcription was significantly up-regulated in p27Kip1-knockout cells compared with wild-type counterparts, and mapping of a crucial Egfr promoter region for p27Kip1 suppression of Egfr transcription.
(A) Western blotting analysis of p27Kip1 and EGFR protein levels in p27Kip1+/+ compared with p27Kip1−/− MEFs. GAPDH was used as a protein loading control. (B) Egfr mRNA expression levels in p27Kip1+/+ compared with p27Kip1−/− MEFs was determined by RT–PCR. Gadph was used as a loading control. (C) Egfr promoter luciferase reporter plasmids were stably transfected into p27Kip1+/+and p27Kip1−/− MEFs in combination with pRL-TK used as an internal control. Results are presented as Egfr promoter activity of p27Kip1+/+ cells relative to p27Kip1−/− cells respectively. Values are means±S.D. for triplicate assay wells. (D) A schematic diagram of the various deletions of the Egfr promoter luciferase reporter with the open circles corresponding to AP-1-binding sites. The 5′ end maps to the following positions: pER4-luc (−911), pER6-luc (−771), pER9-luc (−384), pER10-luc (−150) and pER15-luc (−105). (E) A series of Egfr promoter-driven luciferase reporter stable transfectants were seeded into each well of 96-well plates. Cells were extracted with lysis buffer for a luciferase activity assay using the luciferase assay system (Promega). Results are presented as luciferase activity relative to the p27Kip1−/− MEFs transfected with pER4-luc only. Values are means±S.D. for triplicate assay wells. (F) Bioinformatics analysis indicating transcription factor AP-1-binding sites in the Egfr promoter area within −771 to −384. (G) Others transcription factors and c-Jun target protein including COX-2 and Fos B in p27Kip1+/+ and p27Kip1−/− MEFs were evaluated. GAPDH was used as a protein loading control.

