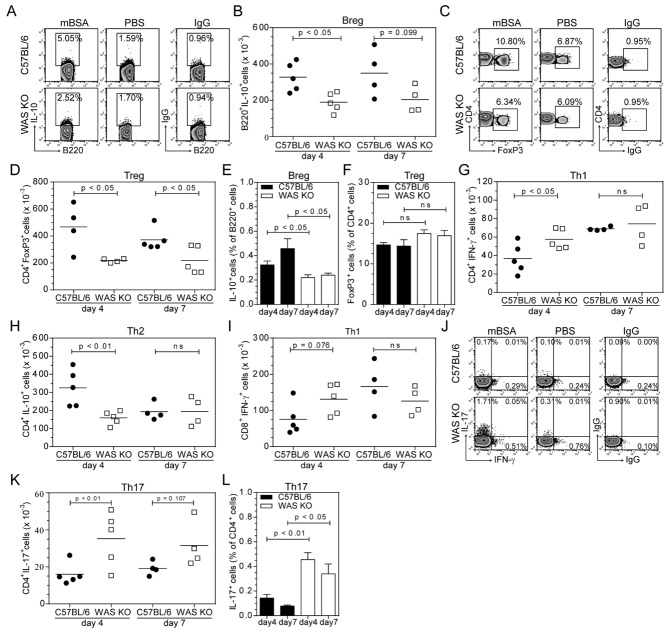
Figure 2.
Decreased Breg cells and Treg cells and increased Th17 cells in experimental arthritis in WAS KO mice. (A) Breg cells were identified as B220+ cells expressing IL-10 by flow cytometry. IgG controls are shown in rightmost panels; (B) the data are presented as absolute cell numbers. (C) FoxP3 expression identified CD4+ Treg cells, IgG controls shown in rightmost panels; (D) the data are presented as absolute cell numbers. (E) Splenic Breg cells and (F) splenic Treg cells were analyzed by flow cytometry. (G) Quantification of IFN-γ-expressing CD4+ T cells, (H) IL-10-expressing CD4+ T cells, and (I) IFN-γ-expressing CD8+ T cells by flow cytometry. (J) Differential expression of IL-17 and IFN-γ, based on IgG controls (rightmost panel), of CD4+ lymphocytes was used to analyze and (K, L) quantify the presence of Th17 cells in (K) LNs or (L) spleen. Dot plots represent day 4 data and statistical significance was determined by Student's t-test. (B, D, G–I, K) Each symbol represents an individual mouse and bars represent means, from a single performed experiment. (E–F, L) Data are shown as mean ± SEM of n = 5 at day 4 and n = 4 at day 7 from a single experiment.

