Figure 1.

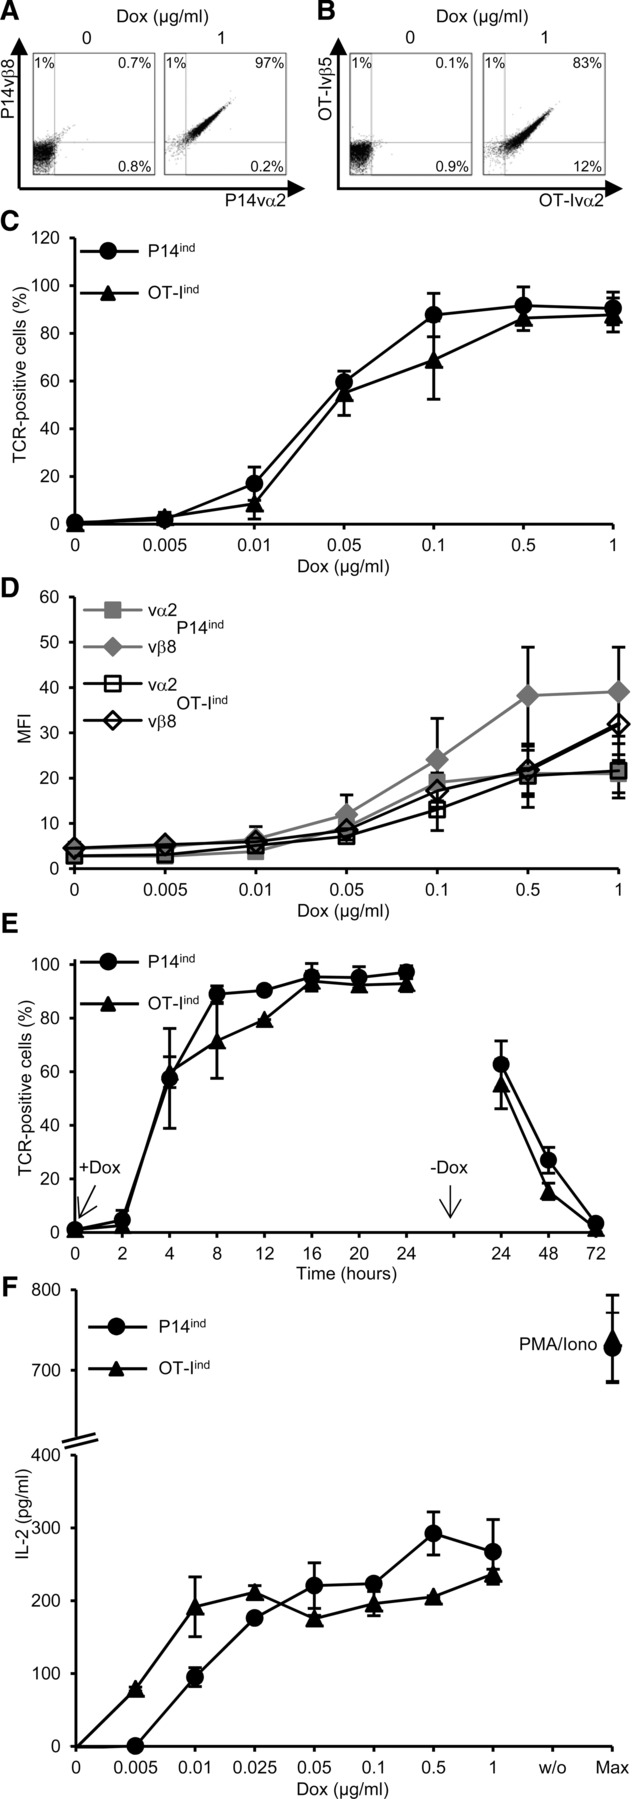
Inducible TCR expression in single TCR-Tg T cells. T-cell clones expressing P14ind or OT-Iind TCR were seeded at a density of 4 × 10⁵/mL and incubated for 24 h with different concentrations of Dox. TCR expression was analyzed by flow cytometry and living cells discriminated in FSC/SSC dot plot. Dot plot of (A) P14ind or (B) OT-Iind living cells stained for TCR chains. (C) Percentages or (D) MFI of TCRvα and TCRvβ chain double-positive cells as a function of Dox concentration. (E) Percentage of TCR-positive cells as a function of incubation time in presence of Dox (1 μg/mL). (C–E) Data are shown as mean ± SD (n = 3–6) and are pooled from at least three independent experiments. (F) Co-cultivation of Dox-induced TCR-expressing 58 T cells with irradiated C57BL/6 splenocytes loaded with 10 μM peptide (gp33–41 for P14 TCR and OVA257–264 for OT-I TCR). As a control no peptide (w/o) or an unspecific stimulus with PMA and ionomycin (max) was added. IL-2 amount was determined by ELISA. Bars indicate mean of duplicates and mean deviation. One representative experiment of two is shown.
