Figure 2.
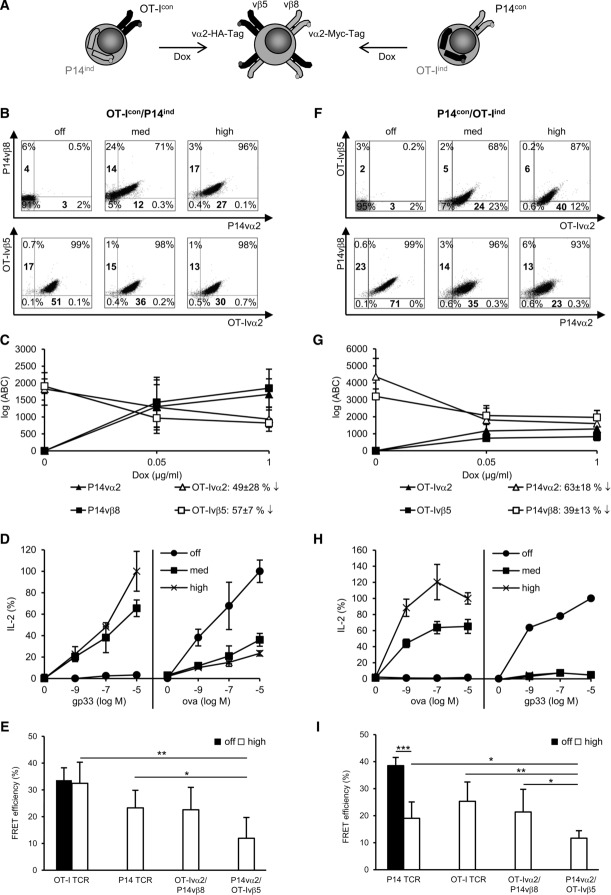
Analysis of TCR expression, functionality, and TCR mispairing in dual TCR T cells. (A) Schematic picture of the generation of dual TCR T cells. Fifty-eight T cells (4 × 10⁵/mL) were incubated for 24 h with 1 μg/mL (high), 0.05 μg/mL (med), or without (off) Dox. Dot plots of cells stained for (B) constitutively expressed OT-I TCR and induced P14 TCR (OT-Icon/P14ind) or for (F) constitutively expressed P14 TCR and induced OT-I TCR (P14con/OT-Iind). (B, F) Bold numbers indicate MFI. Quantification of TCR chains in (C) OT-Icon/P14ind cells and (G) P14con/OT-Iind cells. Antibody binding capacity (ABC) represents molecules on cell surface. (C, G) Data are shown as mean ± SD (n = 3) and are pooled from three independent experiments. IL-2 secretion as a function of constitutive and induced TCR expression in (D) OT-Icon/P14ind cells and (H) P14con/OT-Iind cells after 24 h co-cultivation with gp33/OVA peptide-loaded splenocytes. IL-2 amount, measured by ELISA, is given as percentage of the maximal secretion, which was determined for TCRind at 10 μM cognate peptide and high Dox (P14ind: 63 pg/mL; OT-Iind: 141 pg/mL) and for TCRcon at 10 μM cognate peptide and without Dox (OT-Icon: 82 pg/mL; P14con: 103 pg/mL). Data points indicate mean of duplicates and mean deviation. For B, D, F, H one representative experiment of three or more is shown. FRET analysis of correctly and mispaired TCRs on dual TCR (E) OT-Icon/P14ind cells and (I) P14con/OT-Iind cells. (E, I) Data are shown as mean + SD (n = 3–5) and are pooled from at least three independent experiments. *p < 0.05, **p < 0.01, ***p < 0.001; unpaired Student's t-test.

