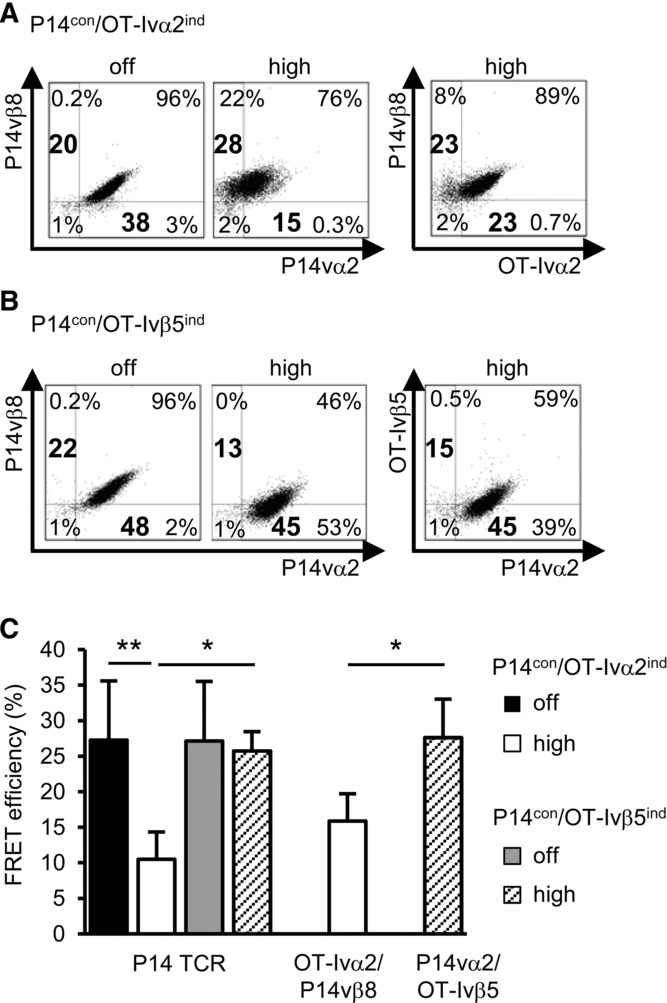
Figure 3.

Induction of single OT-I TCR chains in dual 58 T cells. T cells (4 × 10⁵/mL) were incubated for 24 h with 1 μg/mL (high) or without (off) Dox. TCR chain staining of P14 and (A) P14vβ8/OT-Ivα2 (P14con/OT-Ivα2ind) or (B) P14vα2/OT-Ivβ5 (P14con/OT-Ivβ5ind) is shown as dot plots. One of three experiments is shown. Bold numbers indicate MFI. (C) FRET analysis of correctly and mispaired TCRs on P14con/OT-Ivα2ind or vβ5ind cells. Data are shown as mean ± SD (n = 3) and are pooled from three independent experiments. *p < 0.05, **p < 0.01; unpaired Student's t-test.
