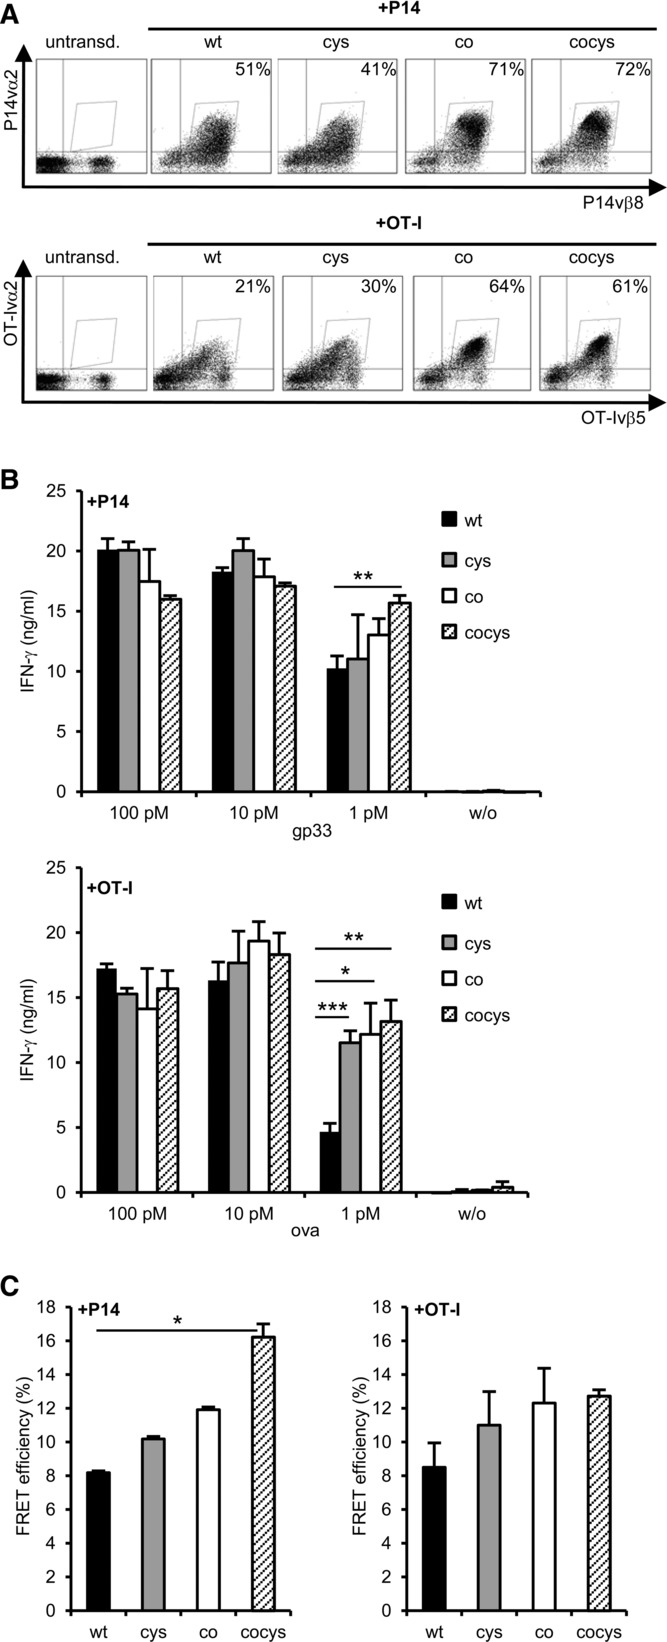
Figure 5.

Primary C57BL/6 T cells transduced with different formats of P14 or OT-I TCRs. (A) C57BL/6 splenocytes were retrovirally transduced with different formats of the P14 (above) and OT-I TCR (below) and transduction rates were determined by TCR staining (P14: vβ8/vα2-Myc-Tag; OT-I: vβ5/vα2-HA-Tag). Live cells were discriminated in FSC/SSC dot plot. (B) IFN-γ secretion of primary C57BL/6 T cells transduced with the P14 (above) or OT-I TCR (below) after 24 h co-cultivation with peptide-loaded splenocytes. Bars indicate mean of triplets and mean deviation. (C) FRET efficiencies were calculated from staining as shown in (A). The mean and mean deviation of two separate measurements was determined. (A–C) Data shown are representative for one experiment out of three performed. *p < 0.05; **p < 0.01; ***p < 0.001; unpaired Student's t-test. cys: cysteineized-TCR with second cysteine bridge; co: codon-optimized TCR; cocys: codonoptimized and cysteineized TCR.
