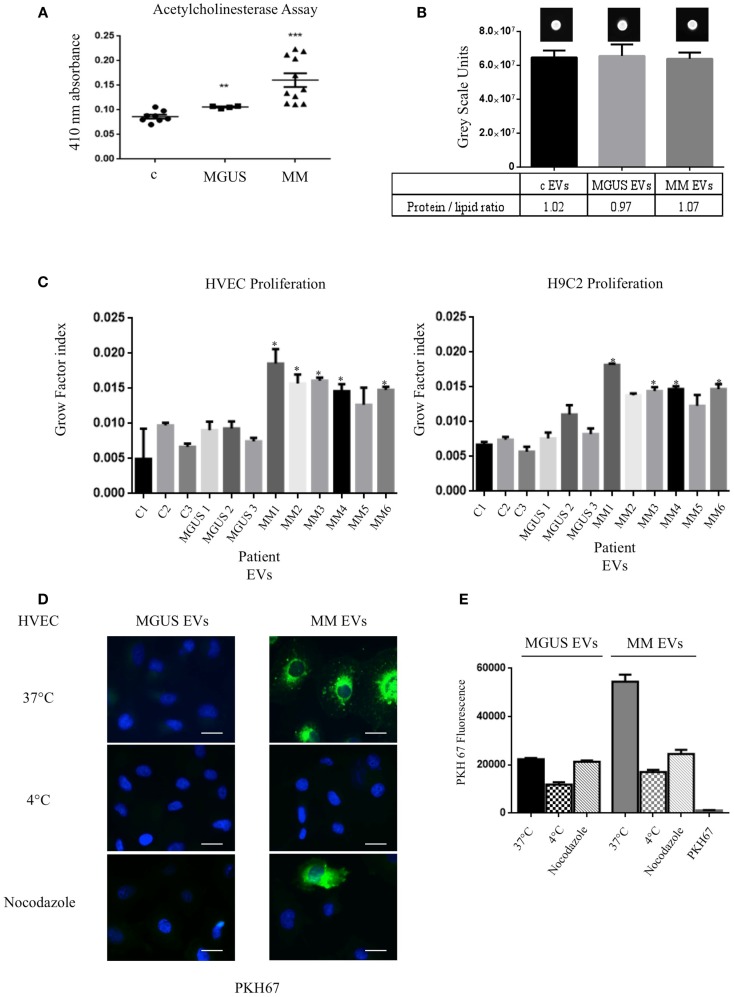
Figure 2.
Internalized MM EVs increase HVEC and H9C2 proliferation. (A) Evaluation of the acetylcholinesterase activity in 50 μg of controls (c, 8 different patients), MGUS (4 patients), and MM (10 patients) crude EVs samples. Significant differences were determined with Student’s t-test: *p < 0.05, **p < 0.01, ***p < 0.001. Values were shown as mean SEM of at least three experiments. (B) Fluorescent (PKH67-labeled) EVs (200 μg of proteins) from controls, MGUS, and MM patients were re-suspended with loading buffer [36% TAE (Tris–acetate–EDTA), 14% H2O, 50% glycerol] to a final volume of 20 μl. Ten microliters were spotted on a nitrocellulose membrane and dots fluorescent signal were acquired using a G:Box Chemi XT Imaging system (Syngene). Signals were quantified with the program Gene Tools. Protein/lipid ratio was quantified for all samples. Mean values ± SEM of at least four different experiments. (C) HVEC and H9C2 cells in serum-free medium were incubated with 50 μg of controls (c1–3, 3 different patient), MGUS (1–3), and MM (MM 1–6) EVs for 24, 48, and 72 h and cell proliferation rate (growth factor) was assessed using crystal violet. Mean values ± SEM for three independent experiments are shown. *p < 0.05, **p < 0.01, ***p < 0.001 (D) HVECs were incubated with PKH67-labeled MGUS and MM EVs (200 μg of proteins) for 4 h at 37°C; as negative controls cells were pre-incubated for 30 min at 4°C or with nocodazole 20 μM at 37°C followed by 4 h of exposure to EVs at 4°C or in the presence of nocodazole. Cells were then washed with PBS 1× and fixed with 3% PFA, permeabilized with 0.3% saponin, and stained with DAPI. Scale bar 5 μm. Coverslips were mounted using an anti-fade mounting medium (ProLong Gold-Invitrogen) on a glass slide. Fluorescent microscopy was performed on a ZEISS Axiovert 100 fluorescent microscope using the 63× Zeiss oil immersion objective. Single sections are shown for each condition. Images were processed with the use of Image pro-plus 4.5.1. (E) PKH67 fluorescence intensity measurement of internalized MGUS and MM EVs before and after endocytosis blockage at 4°C, with nocodazole 20 μM. Internalization rate of PKH67 centrifuged 2 h at 100,000 × g without EVs. (100 Cells each experimental point). Images were processed with the use of Image pro-plus 4.5.1. Mean value and SEM of three independent duplicate experiments are given.

