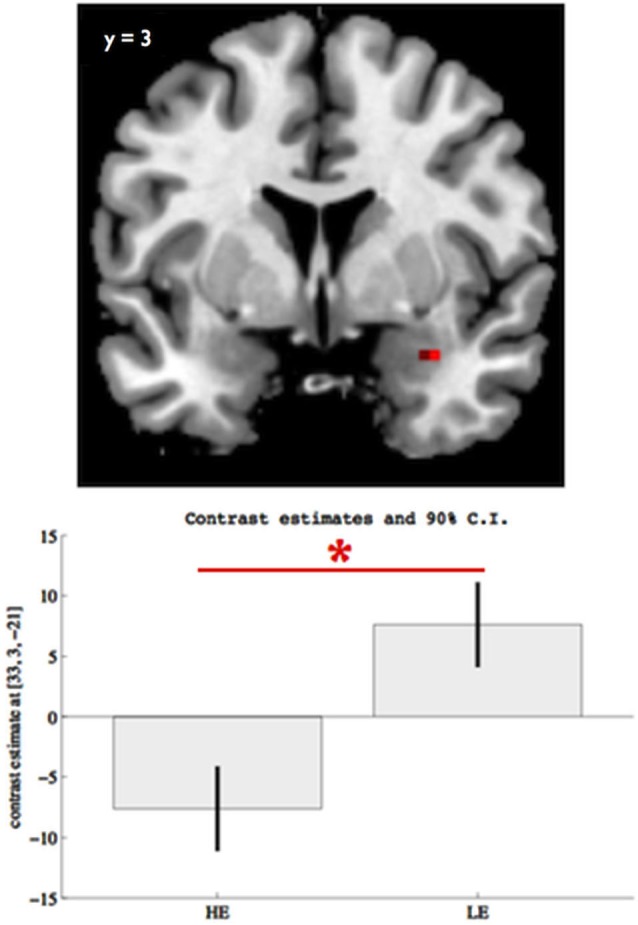
Figure 1.

Group differences on right amygdala (x = 33, y = 3, z = −21) response to facial expressions for pFWE < 0.05, SVC. The boxes indicate the amygdala mean response across all facial expressions (vs. scramble) within each group, while the whiskers indicate the 90% confidence interval. Participants with lower educational attainment (LE) showed significantly elevated right amygdala response to overall facial expression perception, relative to participants with higher educational attainment (HE). The asterisk indicates significant group differences (pFWE < 0.05, SVC).
