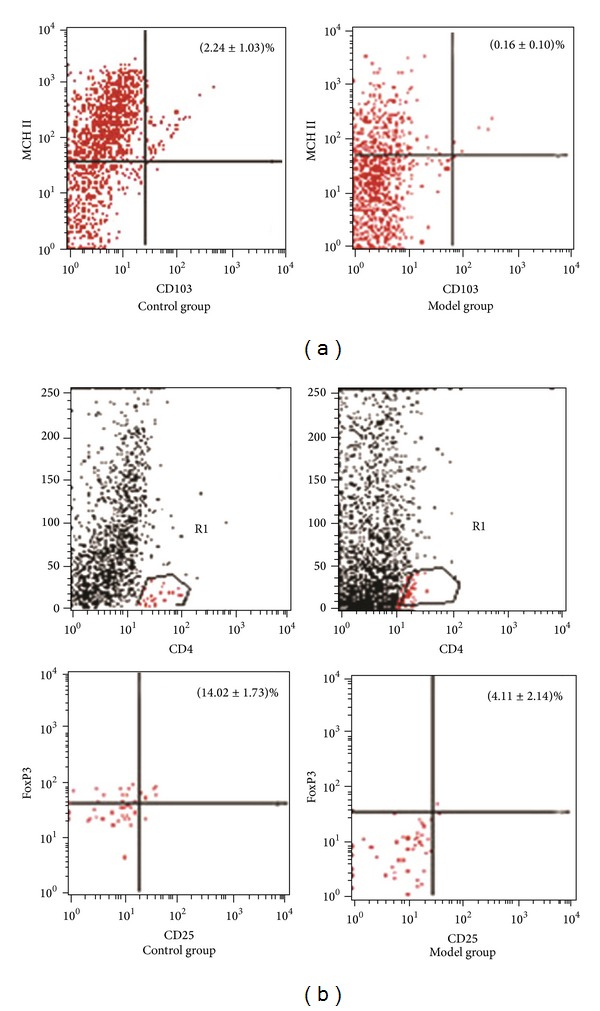
Figure 2.

The percentage of CD103+MHCII+DCs and CD4+CD25+FoxP3+T-regs in the control and model group. (a) In the model group, the percentage of CD103+MHCII+DCs in the total colonic mucosal cells was significantly lower than that in the control group (0.16 ± 0.10 versus 2.24 ± 1.03, P < 0.05). (b) Compared with control group, the percentage of CD4+CD25+FoxP3+T-regs in CD4+T cells was significantly lower in the model group (4.11 ± 2.14 versus 14.02 ± 1.73, P < 0.05).
