
Figure 2.
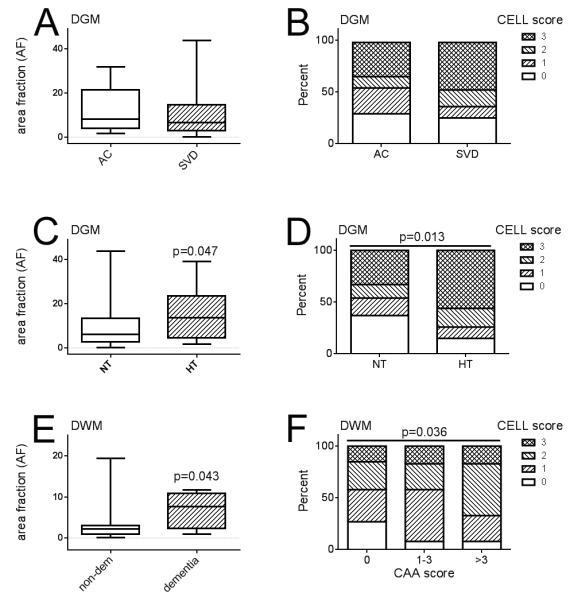
Quantitative assessment of fibrinogen immunolabeling. (A, B) Fibrinogen-positive area fraction ([AF]; range 0-100%) and distribution of fibrinogen labeled cell scores (CELL, range 0, 1, 2 or 3) did not differ between small vessel disease (SVD) subjects and aged control subjects (AC). Data are shown for deep grey matter (DGM). (C, D) Within DGM, fibrinogen-positive AF (C) and distribution of fibrinogen labeled CELL scores (D) were significantly higher in subjects with documented histories of hypertension (HT) vs. those who were documented as being normotensive (NT). (E) Within deep white matter (DWM), fibrinogen-positive AF was greater in those subjects with a documented history of dementia than in subjects without dementia (non-dem). (F) Within DWM, the distribution of fibrinogen labeled CELL scores increased with severity of neuropathological cerebral amyloid angiopathy (CAA) score (range 0–24). Box-whisker plots show median, interquartile range and full range.