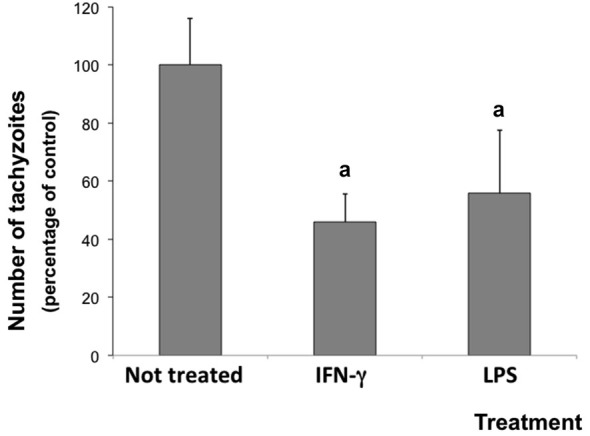
Figure 2.

Number of tachyzoites in rat neuron/glial cell co-cultures treated with 300 IU/mL IFN-γ or 1.0 mg/mL LPS and infected with Neospora caninum tachyzoites (ratio cell:parasite 1:1), 72 h post infection. Results are expressed as means (± standard deviations) of tachyzoite percentages compared to non-treated/infected control cultures (considered as 100%) in three independent experiments carried out in triplicate. “a” represents a significant statistical difference when compared to not treated/infected cultures (One Way ANOVA/Tukey’s Multiple Comparison Test—p < 0.05).
