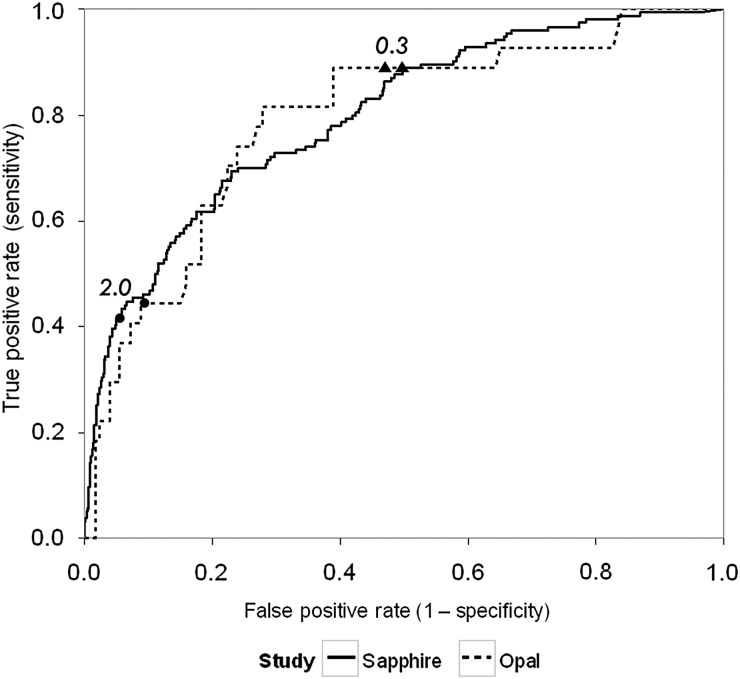
FIGURE 2:
[TIMP-2]•[IGFBP7] ROC curves and operating characteristics for the Sapphire (solid) and Opal (dash) cohorts. Closed triangles and circles indicate [TIMP-2]•[IGFBP7] cutoffs of 0.3 and 2.0, respectively. End point was AKI Stages 2 or 3 within 12 h of sample collection. Area under the ROC curve [95% confidence interval (CI)] = 0.80 (0.74–0.84) and 0.79 (0.69–0.88) for Sapphire and Opal, respectively. NPV and PPVs are presented in Supplementary Data Figure S4 of the supplement.

