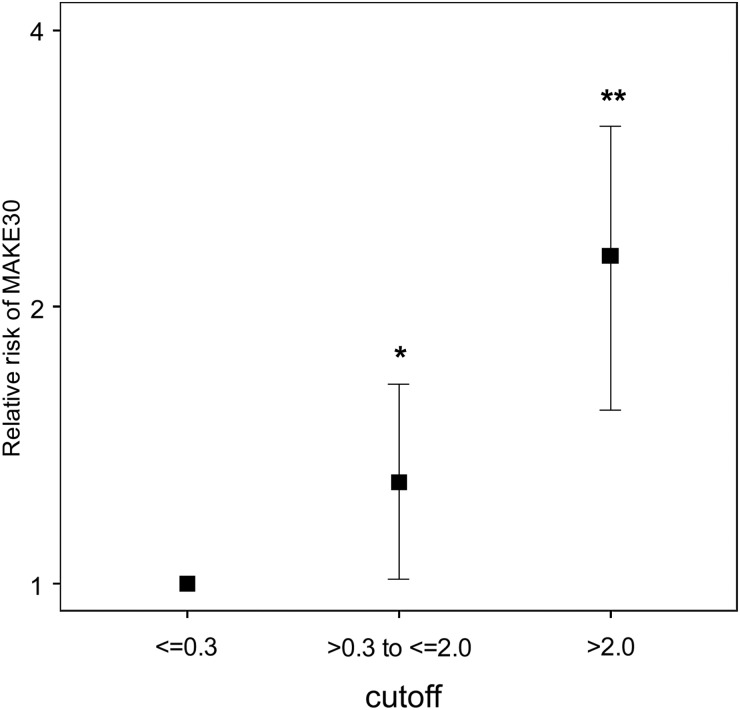
FIGURE 4:
Relative risk of MAKE30 in the Sapphire cohort. Samples were collected within 18 h of enrollment. Risk for each [TIMP-2]•[IGFBP7] range is shown relative to the lowest [TIMP-2]•[IGFBP7] range (≤0.3). Raw risk in lowest stratum = 18%. Error bars indicate the 95% CI. Cochran–Armitage test for significant trend: P < 0.001. *P = 0.036; **P < 0.001.

