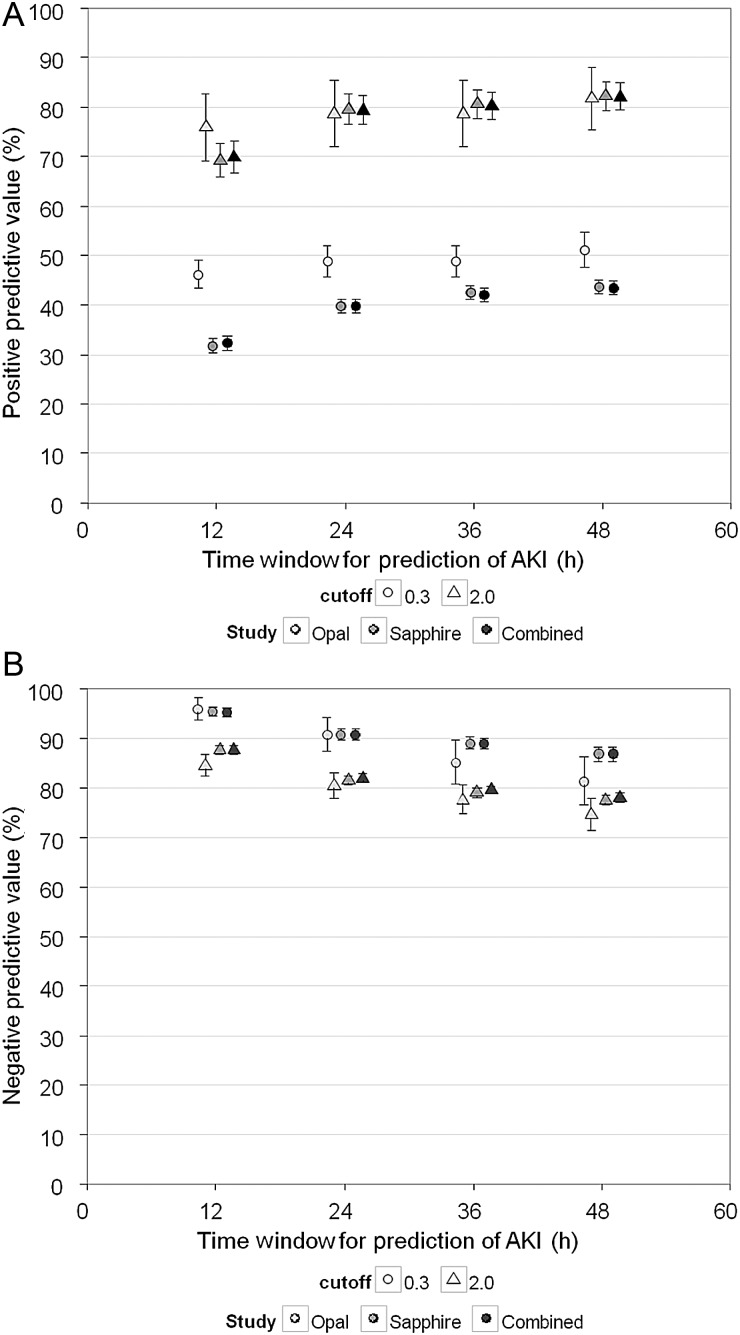
FIGURE 5:
Prevalence adjusted PPV (A) and NPV (B) for [TIMP-2]•[IGFBP7] cutoff values of 0.3 and 2.0 in the Opal (light gray), Sapphire (medium gray) and combined Opal and Sapphire (dark gray) cohort. Samples were collected within 18 h of enrollment. End point is AKI Stage 2 or 3 within the time window for prediction of AKI indicated along the abscissa (zero time = time of sample collection). Prevalence was adjusted to match the AKI distribution from Joannidis et al. [13] as described in the text [13]. Error bars indicate the 95% CI. Median time from a positive test result to a positive end point was 12.5 h [interquartile range (IQR) 2.7–26] for the Sapphire study and 8 h (IQR 0–15.5) for Opal.

